In a recent conversation,1 Dominic Silman and Brian Klinksiek revisited LaSalle’s ISA Outlook themes amid 2025’s rapidly developing and unpredictable geopolitical and macroeconomic climate.
Brian Klinksiek (BK):
The theme of our ISA Outlook 2025 was the ‘Dawn of a New Real Estate Cycle’. Looking back six months later, we’ve been through a rollercoaster of policy change with meaningful shifts in the economic narrative. We covered this in two recent Briefing notes. In the first, we recommended that investors “work backwards” from strategic actions that make sense regardless of macropolitical outcomes; in the second, we pointed to signals from key relativities among asset classes, geographies, and sectors. All those recommendations still stand, but we provide a further update on recent developments in our latest LaSalle Macro Quarterly deck (LMQ), which we released today. Thankfully, many of the most extreme US policies – such as the full “Liberation Day” tariffs – have been paused, at least for now. But as we have pointed out, uncertainty itself has a cost.
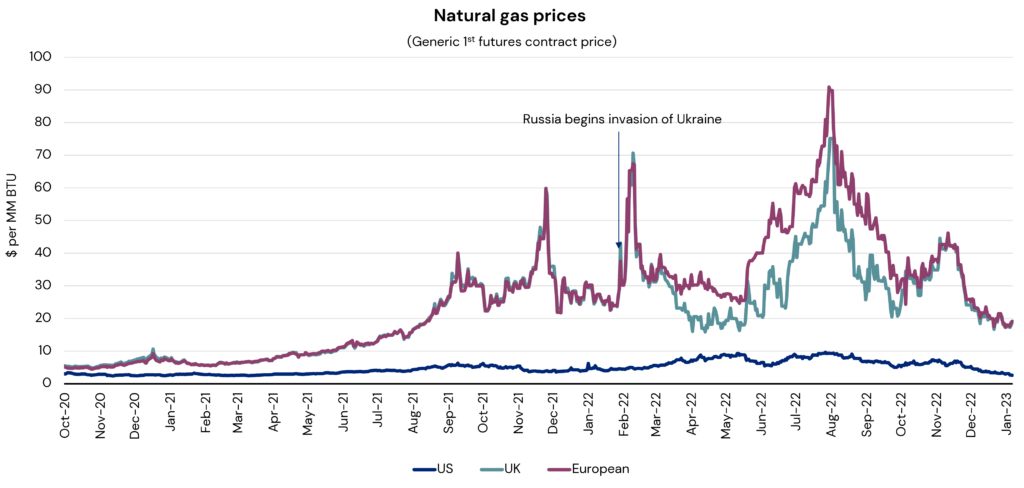
Beyond the trade war, in the past two weeks a real kinetic war unfolded between Israel and Iran, with the US stepping in as well.This is driving energy price volatility and, in the unlikely case of a severe escalation, could lead to the destruction of energy infrastructure in the region, or to the closure of the Strait of Hormuz, a major chokepoint on the global energy map.2 Both could potentially bring stagflation to the global economy.3 In the background, the global political calendar has also been very busy – we’ve seen election results in Canada, Australia, South Korea and Poland, as well as the new German coalition’s shift toward higher spending and investment. Given all this change, where do we stand today? Do we still think it’s the dawn of a new real estate cycle?
“It’s helpful to take a step back and ask: What is actually changing and what is likely to stay the same?”
Dominic Silman (DS):
As you say, it’s been quite a six months! It’s helpful to take a step back and ask: What is actually changing and what is likely to stay the same? For example, despite the movement and uncertainty, it bears mentioning how little has so far changed on the ground in property markets, which we will talk about later.
Among the many changes, we should also ask which are likely temporary and which are permanent. April’s extreme volatility has so far proven temporary; markets are a lot calmer today.4 It reminds me of that British Second World War poster: ‘Keep Calm and Carry On’. Are we carrying on? Certainly. Are markets actually keeping too calm recently, especially given still elevated uncertainty? I think there’s a risk of too much calmness, and too much of an instinct to assume that everything always works out absolutely fine and reverts to “normal”.
1 LaSalle has utilised JLL GPT to transform a transcript of a recorded verbal conversation that is documented in this publication. JLL GPT is a secure, in-house generative artificial intelligence (AI) interface that draws on the underlying models from OpenAI’s ChatGPT and other AI firms. 2Source: Signum Global Advisors, Piper Sandler 3 Source: Oxford Economics 4 As indicated by a significant moderation in indicators of market volatility, such as the VIX for US equities and the MOVE index for US government bonds. Source: LaSalle analysis of Refinitiv data.
Important notice and disclaimer
This publication does not constitute an offer to sell, or the solicitation of an offer to buy, any securities or any interests in any investment products advised by, or the advisory services of, LaSalle Investment Management (together with its global investment advisory affiliates, “LaSalle”). This publication has been prepared without regard to the specific investment objectives, financial situation or particular needs of recipients and under no circumstances is this publication on its own intended to be, or serve as, investment advice. The discussions set forth in this publication are intended for informational purposes only, do not constitute investment advice and are subject to correction, completion and amendment without notice. Further, nothing herein constitutes legal or tax advice. LaSalle takes reasonable steps to ensure the quality of AI-generated content, however LaSalle cannot guarantee the accuracy of AI-generated content. LaSalle does not accept liability for any errors or omissions in the content produced by AI technology and advise that recipients exercise caution when relying on such content. LaSalle is not responsible for consequences which may arise from recipients’ reliance on AI-generated content. Recipients should exercise discretion and seek expert advice when making decisions based on automated information. Additionally, LaSalle reserves the right to modify or remove AI-generated content at any time without prior notice. Prior to making any investment, an investor should consult with its own investment, accounting, legal and tax advisers to independently evaluate the risks, consequences and suitability of that investment. LaSalle has taken reasonable care to ensure that the information contained in this publication is accurate and has been obtained from reliable sources. Any opinions, forecasts, projections or other statements that are made in this publication are forward-looking statements. Although LaSalle believes that the expectations reflected in such forward-looking statements are reasonable, they do involve a number of assumptions, risks and uncertainties. Accordingly, LaSalle does not make any express or implied representation or warranty and no responsibility is accepted with respect to the adequacy, accuracy, completeness or reasonableness of the facts, opinions, estimates, forecasts, or other information set out in this publication or any further information, written or oral notice, or other document at any time supplied in connection with this publication. LaSalle does not undertake and is under no obligation to update or keep current the information or content contained in this publication for future events. LaSalle does not accept any liability in negligence or otherwise for any loss or damage suffered by any party resulting from reliance on this publication and nothing contained herein shall be relied upon as a promise or guarantee regarding any future events or performance. By accepting receipt of this publication, the recipient agrees not to distribute, offer or sell this publication or copies of it and agrees not to make use of the publication other than for its own general information purposes.
Breaking economic patterns: Europe’s real estate landscape
Today’s European market view is of a picture scarcely imaginable a few years ago.
2025 in Europe has a macroeconomic backdrop scarcely imaginable a few years ago: German stimulus spending, Greece in budget surplus and historically reliable real estate correlations – such as that between GDP and prime rents – behaving differently. And that’s on top of still to-be-determined new tariffs faced by Europe’s exporters. As we’ve shared in our recent ISA Briefings, it is helpful to “work backwards” to investment strategy based on what is actionable amidst all the noise.
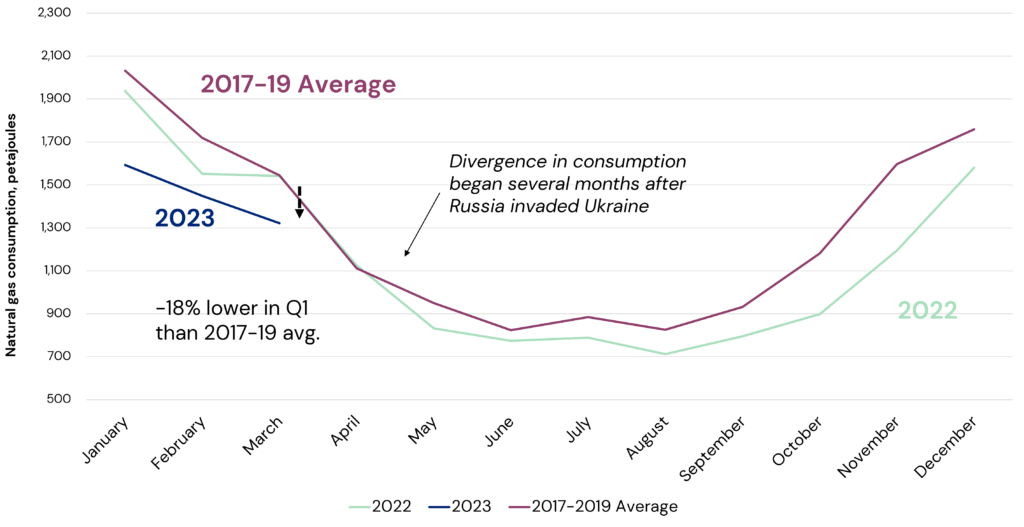
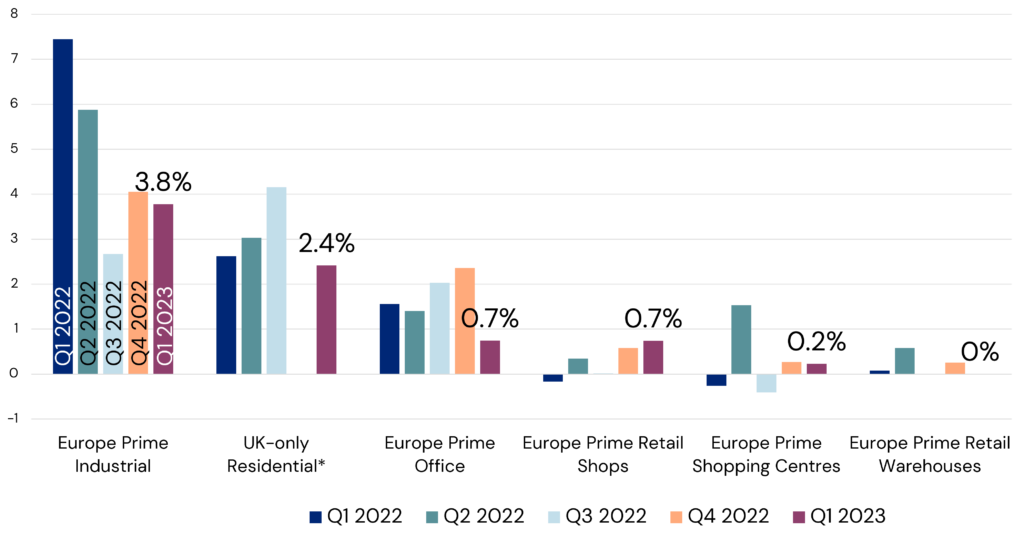
Initial bond and currency market reactions, several highlighted in our latest Europe Market View, imply a relative shift towards Europe as a safe haven. These changes are having ripple effects for European real estate. Easing eurozone borrowing costs have made debt more accretive to go-forward returns, supporting a cautious recovery in investment activity. A stabilization in real estate yields, and the return of yield compression in some segments, are signs of the beginning of a new real estate cycle. The MSCI Europe Property Index capital values have increased for two consecutive quarters following eight quarters of decline.
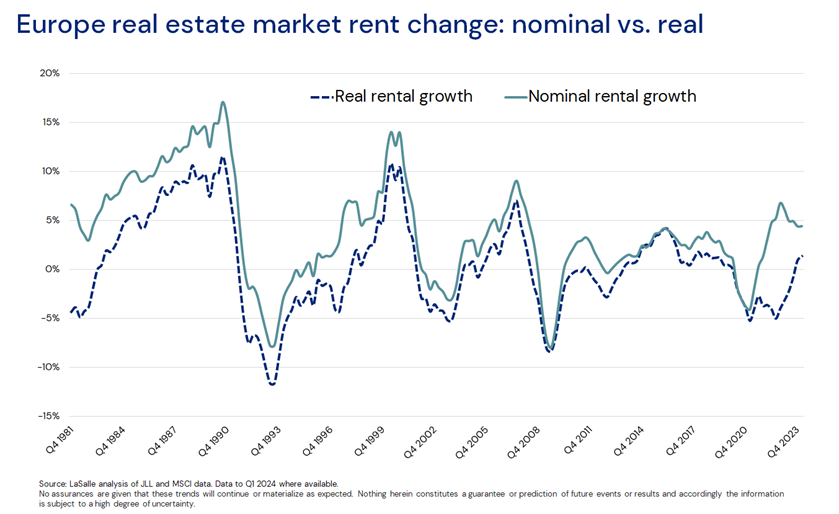
Europe all property inflation-adjusted rent growth has now been positive for six quarters. The wider office market is undergoing a rebalancing cycle with slowing building starts and rising conversions of obsolete offices to other uses helping to keep markets in balance. Conversions in Europe reached 1.4% of stock in 2024 compared to the long-term average of 0.9% p.a.
We graph these trends in our latest LaSalle Europe Market View chartbook. We also look ahead to sharing our ISA Outlook 2025 Mid-Year Update, as we move into the second half of an eventful year.
The what, why and how of Industrial Outdoor Storage (IOS)
Industrial outdoor storage (IOS) real estate is not new, but it has only recently been given a name and a place in institutional investment portfolios. Some in the market define IOS inexactly, or even as they “know it when they see it”. A more precise definition is that it encompasses open-air facilities used by industrial, manufacturing or logistics businesses to store or process equipment, vehicles, materials or products that do not require the protection of warehouse buildings.
IOS is an amalgam of facilities that serve auxiliary but essential functions to the logistics ecosystem. The prominent features of IOS are low site coverage (with FAR1 of less than 20-25% but often zero), zoning designations that allow for heavy industrial uses, and most importantly, value that is driven by underlying land rather than physical structures2. Attributes that are commonly considered in the evaluation of IOS sites include the quality of surfacing (full concrete surfacing to softer gravel surfacing), good vehicle access (light and heavy), and availability of utility and services (water, electricity, fencing/security).
IOS started gaining traction among institutional investors following the industrial sector’s boom in the post-pandemic era. As industrial pricing became more aggressive through the peak of the cycle, the IOS sector’s robust demand growth outlook provided an attractive alternative for investors seeking yield. Interest in IOS remained strong even when the broader capital market entered correction. This has continued in the context of the industrial sector broadly softening as it digests a (now resolving) wave of deliveries, while IOS has proven resilient given that its new supply tends to be much less elastic.
Despite its adjacency to the traditional industrial sector and its proven relevance to users, IOS as a property type has flown under the radar of institutional investors as it is usually transacted in small deals that are local or regional in nature, often involving owner occupiers. There are a few dedicated IOS players whose inceptions date back as early as 2013, but it is only in recent years that the sector came to be viewed as a critical component of the wider supply chain and distribution network.
The body of knowledge on the sector – operational, fundamentals, performance – is limited, but curiosity has been rising from new entrants in the past couple of years that include institutional capital. The IOS sector’s lack of transparency, common in emerging specialty sectors, demands rigorous scrutiny in underwriting. As IOS continues to mature, detailed research and underwriting as well as deep engagement with the local market can help navigate these challenges, enabling investors better assess and mitigate risks.
‘Next-core’3 in the US, emerging in the UK and continental Europe In the US, the aggregate market value of IOS property is commonly estimated to be $200 billion in GAV, but the source of that stat as well as the inclusions and exclusions behind it are unclear.4 While institutional investment in IOS has accelerated in recent years, the sector’s overall ownership remains fragmented with a still-limited institutional footprint.
Meanwhile, IOS is even more nascent among institutional investors in the UK and Europe, but interest is growing. An increasing number of institutional investors are now setting their sights on IOS opportunities across the region. This includes funds dedicated exclusively to IOS, as well as vehicles that incorporate the sector as part of a wider industrial strategy. We estimate that more than £1 billion has either been allocated for investment or has already been deployed into the UK’s IOS sector in recent years. Owing to structural factors, we see much more limited, but not zero, potential for IOS to emerge in the Asia-Pacific region (see below).
Transport-oriented • Port logistics & intermodal transport • Vehicle storage & parking • Freight distribution & cross-docking
Storage-oriented • Construction equipment & bulk material storage • Vehicle or equipment fleets
Source: LaSalle analysis; images created with the assistance of AI
Truck terminals are the only type of IOS that is now explicitly defined in the NCREIF Property Index (NPI, previously “Expanded NPI”), with $5.3 billion in gross market value, or 1.8% of the US industrial index as of 1Q 2025.5 Tracking of other types of IOS is still a work in progress, although the NCREIF Research committee acknowledges the challenge, and has started the process of putting together guidance on how IOS should be classified and tracked to improve transparency. Investors’ desire to gauge the competitor landscape as well as returns supports this effort to define and track IOS as a distinct category in the NPI.
In Europe, there is still a lack of data availability for IOS, but some agents are extending coverage to the sector and starting to publish market data. For example, new data from late 2024 reported that 48% of enquiries for IOS space in the UK was driven by the need for fleet parking, approximately 60% of which was driven by Heavy Goods Vehicle (HGV) parking.6 This need can also be seen in data from a national survey of lorry parking, which reported a 5% increase in the number of on-site parking facilities between 2017 and 2022, even as the national average night on-site utilization at those facilities grew by nine percentage points over the same period to 83%, indicating strong growth in demand and a high occupancy rate for parking spaces.7
Is IOS “a thing” in Asia Pacific?
The Asia-Pacific IOS sector is evolving and yet to be institutionalized. High land values in many Asian markets make low- or no-coverage land sites uneconomic, at least beyond a temporary use. That said, the factors that drive IOS demand in the US are clearly present in the region, especially the need operational flexibility in handling trailers, containers and delivery vehicles, as well as flexibility to store overflow inventory. The confluence of Japan’s acute truck driver shortage and the implementation of stricter truck driver working hour regulations in 2024 is driving demand for specialized IOS-related assets in the long-term, particularly truck terminals. However, in most markets we view these factors as informing improvements to the design of existing multi-story logistics facilities, rather than driving the emergence of a new, investable specialty property type, at least in the near term.
Using a non-traditional data source to identify IOS inventory in the UK
Geographical distribution of UK open storage land vs. warehouse space
Sites classified by VOA as land used for storage and lorry parking are indicated in black, with traditional industrial and warehouse space displayed as a heatmap in red
Data on IOS fundamentals are very limited in the UK and Europe. At least there is a way to estimate the size and shape of the IOS footprint in England and Wales, where the Valuation Office Agency undertakes detailed categorizations of use cases across property types to set business rates, including categories for open storage and lorry parking.i Proprietary analysis of these data by LaSalle identified some 29,000 locations, with a total area of 16,700 acres and an average size of 0.57 acre.ii The locational pattern (black on the map) is correlated with, but generally more broadly dispersed than, the distribution of traditional logistics space (red on the map). This analysis does not capture the entire UK IOS universe, but still highlights the significant size if the opportunity available within UK IOS, and can support investment decisions requiring a view on supply in markets and submarkets.
i Source: Valuation Office Agency ii It must be noted that this approach likely misses a sizeable proportion of IOS that is currently classified within the warehouse category by the Valuation Office Agency, especially where the site itself is dominated by an open space but have a structure making up a smaller portion of overall area.
Joint ventures structured between institutional investors and specialized operators have been a common avenue for deploying capital into IOS. The challenges of limited transparency, as well as the transactional and operational inefficiencies of small deals, are factors that motivate partnerships with operators. However, the day-to-day operation of IOS is more like traditional industrial than a more operationally intense sector (such as self-storage). In addition, IOS portfolios of scale are currently rare compared to traditional industrial, but we expect greater consolidation of ownership as the sector matures. The assembly of institutional-scale portfolios, along with development of third-party leasing and management service providers, should support the sector becoming more “mainstream” over time.
IOS fundamentals are tight and resilient Data on historical industrial fundamentals illustrates consistently lower vacancy and reduced volatility for IOS assets like truck terminals and service facilities, compared to larger industrial buildings (see adjacent charts). The sector benefits from a weaker elasticity of supply, stemming from stringent zoning regulations and community resistance to new IOS facilities. Local municipalities are hesitant to approve them due to the perceived unappealing aesthetics of open-air industrial operations, and an assumption that they have limited potential for generating jobs and taxes. Data challenges remain in holistically assessing fundamentals of IOS sector that take multiple forms; however, the available data suggest a superior track record of fundamentals as well as outlook that is better protected from future development risks.
LOOKING AHEAD >
Several key attributes of IOS suggest it is well positioned to perform strongly:
• Tailwinds of the broader industrial sector: The growth of e-commerce and an emphasis on just-in-time delivery have boosted demand for strategically located industrial service facilities. Whether as a point of transfer, servicing freight vehicles or serving as supplementary outdoor warehousing, various stages of logistics operation require IOS sites. These should be in close proximity to the industrial clusters and population that they serve, and are often infill locations.
• Favorable supply dynamics: New development is limited due to the scarcity and high cost of suitable land — i.e., large sites with the appropriate zoning in proximity to population centers. Stringent zoning regulations and community resistance to new facilities — due to concerns such as noise pollution, increased traffic, and environmental impact —further create barrier to entry. This is a differentiator as compared to traditional industrial, which is currently experiencing softer fundamentals due to a recent supply wave.
• Operational resilience: IOS facilities typically present low operational risks for investors. The simplicity of these assets, usually combined with triple-net lease structures that place maintenance responsibilities on tenants, result in minimal capital expenditures and higher cash returns. The limited availability of alternative facilities contributes to high tenant retention rates, enhancing cash flow stability. The impact of tariff-driven uncertainties on IOS is expected to vary. While port and trade-linked IOS sites are more exposed, those serving local populations should demonstrate more resilience.
• Increasingly liquid and institutional: As recognition of the attractive value proposition of IOS grows, partnerships between institutional capital and professional operators to invest in it are being launched. This is not only likely to improve the management of assets, but should also provide a track record of sector performance. We anticipate a gradual compression of the yield spread between IOS and traditional industrial properties, supported by continued institutional capital flow to the sector and falling perceived risks.
1 FAR refers to floor-area ratio, which measures the relationship between land area and internal building area.
2 Source: JLL Research 2023.
3 Under the LaSalle Going Mainstream framework for maturation of niche sectors. “Next-core” is characterized by professionalization where specialists begin to track performance, transparency is rising, and the income quality is proven.
4 GAV refers to Gross Asset Value. The origin for this widely cited number appears to be the PwC Investor Survey.
5Source: NCREIF 4Q 2024. NCREIF refers to the National Council of Real Estate Investment Fiduciaries and publishes indices tracking the performance of real estate in the US directly held by institutional investors and by institutional funds. Launched in 1Q 2024, the Expanded NCREIF Property Index (NPI) encompasses a wider array of property sectors and subtype designations than the Classic NPI, aimed at aligning performance measurement with the broader industry’s investable universe.
6 Source: Carter Jonas 2024
7 Source: UK Department for Transport
Important Notice and Disclaimer
This publication does not constitute an offer to sell, or the solicitation of an offer to buy, any securities or any interests in any investment products advised by, or the advisory services of, LaSalle Investment Management (together with its global investment advisory affiliates, “LaSalle”). This publication has been prepared without regard to the specific investment objectives, financial situation or particular needs of recipients and under no circumstances is this publication on its own intended to be, or serve as, investment advice. The discussions set forth in this publication are intended for informational purposes only, do not constitute investment advice and are subject to correction, completion and amendment without notice. Further, nothing herein constitutes legal or tax advice. Prior to making any investment, an investor should consult with its own investment, accounting, legal and tax advisers to independently evaluate the risks, consequences and suitability of that investment. With reference to the graphs included in this publication, note that no assurances are given that trends shown therein will continue or materialize as expected. Nothing herein constitutes a guarantee or prediction of future events or results and accordingly the information is subject to a high degree of uncertainty. LaSalle has taken reasonable care to ensure that the information contained in this publication is accurate and has been obtained from reliable sources. Any opinions, forecasts, projections or other statements that are made in this publication are forward-looking statements. Although LaSalle believes that the expectations reflected in such forward-looking statements are reasonable, they do involve a number of assumptions, risks and uncertainties. Accordingly, LaSalle does not make any express or implied representation or warranty and no responsibility is accepted with respect to the adequacy, accuracy, completeness or reasonableness of the facts, opinions, estimates, forecasts, or other information set out in this publication or any further information, written or oral notice, or other document at any time supplied in connection with this publication. LaSalle does not undertake and is under no obligation to update or keep current the information or content contained in this publication for future events. LaSalle does not accept any liability in negligence or otherwise for any loss or damage suffered by any party resulting from reliance on this publication and nothing contained herein shall be relied upon as a promise or guarantee regarding any future events or performance. By accepting receipt of this publication, the recipient agrees not to distribute, offer or sell this publication or copies of it and agrees not to make use of the publication other than for its own general information purposes
Two 90-day pauses, one on retaliatory tariffs with China and the other on the so-called “liberation day” tariffs, have not liberated markets from uncertainty. However, these course corrections have at least shown that the US administration has limits to its willingness to tolerate extreme market movements, particularly increases in Treasury yields, or severe outcomes for consumers such as product shortages1. They have also contributed to a more benign recent market environment than at the beginning of April.
That said, the future “steady state” of trade policy remains unknowable because it rests on a host of complex political, legal and diplomatic factors2. Even if it became clear where tariffs will settle, economic and real estate forecasting would still be challenging because the US administration has proposed a large and rapid change in the global trading system with little historical precedent3. Moreover, there is the additional variable of time — the longer uncertainty hangs over the economy, the greater the likely cost to investment and growth.4
What is a real estate investor to do? In our last ISA Briefing note, “Working backwards: Dealing with unprecedented policy uncertainty,” we cautioned against spending too much time or effort guessing exactly what comes next. Instead, we argued for pursuing strategies that are broadly prudent, aligned with long-term themes and likely to enhance the resilience of a portfolio, regardless of the state of the world. Our specific recommendations include seeking diversification and building a permanent allocation to real estate debt.
In this note, we take our analysis a step further to highlight three key relativities that we suspect are likely to hold, even as the absolute path of policy and the economy is unknown. These comparative assessments are rooted in our analysis of private real estate markets, confirmed by signals from public markets, and framed in the context of our Fair Value Analysis (FVA) approach. Even with all the uncertainty around absolutes, seeking conviction in key relativities can be helpful when making investment decisions.
1. Real estate relative to other asset classes
Real estate as an asset class does not exist in isolation. Although all assets face uncertainties due to trade turbulence, we believe real estate is relatively well positioned in today’s environment for three reasons. First, real estate has several attractive structural characteristics that should help it weather today’s stormy environment. Real estate values are underpinned by defensive, durable cash flows, backed in numerous sectors by long leases5, and supported in many cases by secular demographic drivers. In addition, the link between market rents and the cost of construction materials provides an indirect and imperfect, but meaningful, connection between inflation and property values6. Tariffs are likely to drive up the cost of construction in any country that raises tariffs on key construction inputs, and that pushes up the rents required to justify new development.
Second, these structural factors are reinforced by mostly healthy current real estate market conditions, as property markets today are not characterized by major imbalances. In our ISA Outlook 2025, we noted falling supply levels, a repricing process mostly in the rear-view mirror, and conservative overall leverage levels in most segments of the market. These factors continue to apply, despite new uncertainties around trade.
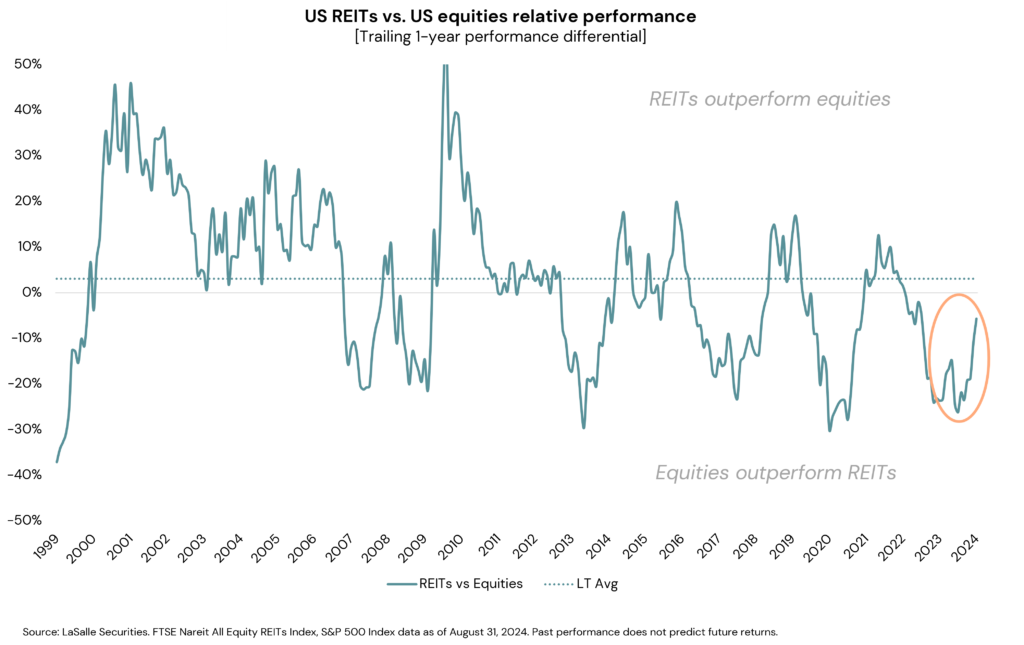
Third, real estate valuations appear less stretched than those of several other major asset classes, especially large-cap equities. As nominal rates rose and credit spreads fell over the past few years, real estate underperformed general equities, cumulatively underperforming by ~30% since the end of 2021 (see adjacent chart). As the environment has shifted, it is possible that real estate’s underperformance could reverse. From a relative valuation perspective, global REITs would need to outperform equities by around 15-20% as of April 30th to simply bring the historical earnings yield relationship back in line with its long-term average.7
2. Relative sector outlook
The trade war has the potential to impact virtually every assumption that goes into a Fair Value Analysis (see sidebar for more background on FVA). When the components of FVA are especially uncertain and volatile, as they are today, it helps to focus on the elements for which greater conviction is possible. Moreover, we recommend emphasizing relative assessments, which can be easier to build conviction around than absolute forecasts.
The channels by which tariffs impact real estate sectors can be classified as either direct and specific, or indirect and macro-related. In terms of trade-specific channels, we highlight that some sectors have unique dynamics that are directly shaped by barriers to the flow of goods. The poster child for this is industrial/logistics real estate. Given this property type literally houses the economy’s supply chains, it is clearly exposed to forces that are likely to disrupt and potentially reshape supply chains.
In the near term, decision-making by logistics occupiers is likely to slow.8 Markets and sub-markets exposed to trade, such as around major ports, may see reduced demand. It is worth noting that trade-related logistics demand generally tends to be greater nearer the points of import and consumption, rather than the points of manufacture and export. Thankfully, the long-term context of logistics real estate is one of positive structural growth, which means this impact takes the form of a downgrading, not a devastation, of the sector’s prospects. Moreover, in the long run, global economic fragmentation could lead to greater supply chain redundancy and therefore increased aggregate space demand.
What is Fair Value Analysis (FVA)?
Fair Value Analysis, or FVA, is central to LaSalle’s investment strategy process. We conduct FVA across a range of “slices” of the property market—that is, various combinations of sectors, sub-sectors, cities, sub-markets, quality grades and the like. The FVA methodology compares our assessment of expected and required returns:
• Expected Returns (ERs) represent the return expected for a given real estate slice, which is build-up of current real estate entry pricing, plus short and long-term income growth, minus an estimate of the capital expenditure needed to keep the property competitive. • Required Returns (RRs) represent an appropriate risk-adjusted cost of capital for a given slice, starting with bond yields and applying sector- and market-appropriate risk premia.
It is possible to extract both absolute and relative pricing indications from FVA. By comparing ERs and RRs, we can assess which slices appear attractively priced (ER>RR), fairly priced (ER≈RR) or overpriced (ER<RR). But implicit in this absolute analysis is a presumption that current bond yields are “correct;” its conclusions tend to be volatile in periods when bond markets are volatile. That is why is also helpful to simply rank order the ratio of ERs to RRs, which produces a relative sorting of attractiveness by slice. Relative assessments help steer investment toward the real estate most likely to outperform the broader property market.
Other examples of real estate sectors facing impacts directly tied to tariffs include US power centers exposed to discretionary expenditure on (largely) imported goods. There are also potential direct impacts on real estate from other Trump policies beyond tariffs, for example around reputational issues that seem to be suppressing inbound and outbound tourism, as well as changes to scientific research funding.9
To understand the broader macro channels of impact, it is useful to assesses real estate sectors and markets by their relative sensitivities to economic growth and to interest rates.10 Sectors with a high degree of economic sensitivity, such as hotels, are likely to see an outsized negative hit to their cash flows in the event of an economic downturn. Meanwhile, economic impacts should be muted on sectors with low fundamental sensitivity to GDP growth, such as medical office.
Relative impacts are potentially the reverse for sectors with a high degree of interest rate sensitivity. An economic downturn usually leads to lower interest rates – although recent market movements suggest that is not necessarily a given.11 The impact of lower rates on the more interest-rate sensitive parts of the real estate market could enable them to absorb some or even all the effect of softer demand. These property types are generally those with longer leases, such as the mainstream commercial sectors.
Relative listed real estate performance following “liberation day”, confirms these intuitive sector relativities. Despite an initial drawdown of nearly 10%, the overall listed REIT market was down only marginally for the rest of April, though the dispersion of property sector performance has been wide (see adjacent chart). Initial investor reactions have been most focused in property types which are most directly exposed to a potential trade war (e.g., industrial/ logistics) or those which are more economically sensitive in nature (lodging).
3. Relative global impacts
The same relative-value thinking can be applied to the relative prospects ofcountries and regions, which have been dynamic this year, to say the least. The economic narrative has quickly shifted from the post-election consensus of dominance by the US economy, to post-inauguration worries about fallout from US trade policy alongside a growth-positive break in European fiscal policy.12
Indeed, it seems likely that tariff-related worries may hit US real estate more than in many other countries, for two reasons. First, the strongest headwinds in many exporting nations will be largely contained to specific industries, compared to potentially generalized challenges in the US.13 A second is that the US Fed will have to balance risks of higher unemployment against those of higher prices, while in other countries, the short-term impact of tariffs could drive local goods prices lower. This may give ex-US central banks wiggle room to offset a weaker economy with policy easing.
To separate relatively harder-hit from less-hit ex-US markets, we track the level of applied tariffs and a country’s exports to the US as a share of the exporting country’s GDP. On this basis, the map shows that China, Southeast Asia, Canada and Mexico may be more impacted, while Australia and Europe potentially could be less so. The nature of the exports themselves also matters. It may be difficult to find viable substitute suppliers for many complex, high-value goods (e.g., cutting-edge semiconductors), or for raw materials (rare earths). Countries whose exports have fewer substitutes may be more insulated from the trade war.
A final factor to consider is that the economic sensitivity of property varies by sector and country, but real estate’s return beta is especially low in some market segments, such as the European living sectors.14 The degree to which a sector’s drivers are inward- or outward-facing can also matter. For example, we observe that real estate in Japan, with its large domestic market, tends to see robust investor and tenant demand that may be less susceptible to external forces.15
These relativities have been evident in the performance of US and ex-US listed real estate markets. The shift in US trade policy has led to the largest REIT share price declines being registered in the US (see adjacent chart). European REIT markets, including the UK, have been relative winners given the potential pro-growth developments in fiscal policy and a more limited direct impact from US trade policy. Asia Pacific REIT market performance has been more mixed in this period, with Japan and Australia notable outperformers.
LOOKING AHEAD >
• In normal times, recession probabilities reference probabilistic models that draw on indicators of economic activity, relating current levels to the historical incidence of recessions. In today’s environment, recession probabilities are better thought of as the weighted odds of various trade policies being implemented. In the context of such uncertainty, we recommend focusing less on absolute forecasts, and more on relativities that we expect to hold no matter the ultimate outcome.
• Fair value analysis (FVA) is our preferred tool for comparing, framing and debating investment strategy. It can also be a helpful framework for scenario modeling in uncertain times such as today. But quickly rebalancing real time private, direct real estate portfolios to take advantage of rapid changes in relative value is difficult if not impossible. We use FVA to inform portfolio additions and exits, as we incrementally migrate overall portfolio allocations toward the sectors and markets that are most attractively priced. We believe doing so can contribute to outperformance versus the overall market.
• More immediate execution is available in listed real estate markets, allowing investors to capitalize on shorter-term mispricing and relative value shifts. Periods such as this trade war episode are great examples of times when having a public real estate allocation can provide maximum opportunity to benefit from volatility.
1 The April 9th reciprocal tariffs pause may have been in response to a meaningful increase in Treasury yields, to which the administration seems more reactive than equity markets. The April 12th China pause appears timed to preempt the expiration of “on water” exemptions for goods already en route. Sources: Piper Sandler and Signum Global Advisors.
2 Contributors to uncertainty include: legal challenges to presidential trade authority; negotiations between the US and other nations; potential Congressional action, especially after the mid-term elections; and of course, unilateral adjustments by the administration. Sources: Piper Sandler and Signum Global Advisors.
3 According to Goldman Sachs, the US average tariff rate has increased from ~3% to ~20% in the past few months, even before the paused tariffs. For comparison, the 1930 Smoot-Hawley tariffs represented a rate increase of only a few percentage points, off of already high levels. Moreover, trade is today roughly three times as large a share of the US economy as it was then. As such, there is no clear precedent for a tariff increase of this magnitude.
4 According to analysis by Piper Sandler and Baker, Bloom and Davis, 2016.
5 Leases are, in some sense, only as defensive as the revenues of the tenant. But crucially, they are mediated by the option to relet a building to another tenant. In essence, real estate is a layer of abstraction removed from the tenants’ businesses, just as the tenant is in turn a layer of abstraction higher than any specific product (because they may have multiple products). Just as products have widely varying success/failure profiles, companies are a kernel on products, so their success/failure rate is in turn smoothed, and real estate is a further kernel on businesses.
6 The cash flow characteristics of real estate, including its inflation pass-through potential, are discussed in greater depth in our ISA Portfolio View report.
7 LaSalle has tracked and compared the relationship of REIT AFFO yields to Equity earnings yields for the period of April 2006 through April 2025. Using this data series, we estimate that the relative performance of REITs that would be needed as of the latest data point to revert the relationship to the historical average, assuming all else equal.
8 The commentary in this paragraph is based on LaSalle analysis and that of Green Street Advisors and CBRE-EA.
9 We are monitoring hotel markets with a high share of international visitors; US student housing assets that are heavily exposed to international students (with European student housing potentially benefiting); and life sciences real estate.
10 LaSalle’s Portfolio Balance framework describes real estate market segments according to their sensitivities to economic growth and interest rates. It classifies markets and sectors into four categories: growth-led, rate-led, stable, and reactive. For a fuller discussion, see the ISA Outlook 2025.
11 Bond yields typically fall as economies go into recession because the market prices in central bank easing (rate cuts) and lower inflation. However, this is not always the case. Recent upward volatility in US 10-Year Treasury yields has been attributed to movement in the risk premium required for investing in dollar assets, given concerns that recent rapid changes in economic policy herald longer-term US policymaking instability. Sources: Piper Sandler and Oxford Economics.
13 For example, LaSalle estimates the impact of US tariffs on the German automotive industry to represent just 0.04% of European GDP, using data from Oxford Economics. We derive this by dividing the $25.5bn German auto exports to the US by the eurozone’s $15.9tn GDP, multiplied by 25% tariffs (assuming unit elasticity and no export redirection).
14 European residential markets have seen strong rental growth in recent years, even as GDP growth was weak, owing to long-term structural supply shortages. Source: LaSalle analysis of data from PMA and Green Street.
15 According to analysis by LaSalle of data from JLL REIS and MSCI Real Capital Analytics.
Important Notice and Disclaimer
This publication does not constitute an offer to sell, or the solicitation of an offer to buy, any securities or any interests in any investment products advised by, or the advisory services of, LaSalle Investment Management (together with its global investment advisory affiliates, “LaSalle”). This publication has been prepared without regard to the specific investment objectives, financial situation or particular needs of recipients and under no circumstances is this publication on its own intended to be, or serve as, investment advice. The discussions set forth in this publication are intended for informational purposes only, do not constitute investment advice and are subject to correction, completion and amendment without notice. Further, nothing herein constitutes legal or tax advice. Prior to making any investment, an investor should consult with its own investment, accounting, legal and tax advisers to independently evaluate the risks, consequences and suitability of that investment. With reference to the graphs included in this publication, note that no assurances are given that trends shown therein will continue or materialize as expected. Nothing herein constitutes a guarantee or prediction of future events or results and accordingly the information is subject to a high degree of uncertainty. LaSalle has taken reasonable care to ensure that the information contained in this publication is accurate and has been obtained from reliable sources. Any opinions, forecasts, projections or other statements that are made in this publication are forward-looking statements. Although LaSalle believes that the expectations reflected in such forward-looking statements are reasonable, they do involve a number of assumptions, risks and uncertainties. Accordingly, LaSalle does not make any express or implied representation or warranty and no responsibility is accepted with respect to the adequacy, accuracy, completeness or reasonableness of the facts, opinions, estimates, forecasts, or other information set out in this publication or any further information, written or oral notice, or other document at any time supplied in connection with this publication. LaSalle does not undertake and is under no obligation to update or keep current the information or content contained in this publication for future events. LaSalle does not accept any liability in negligence or otherwise for any loss or damage suffered by any party resulting from reliance on this publication and nothing contained herein shall be relied upon as a promise or guarantee regarding any future events or performance. By accepting receipt of this publication, the recipient agrees not to distribute, offer or sell this publication or copies of it and agrees not to make use of the publication other than for its own general information purposes.
A reader waking up from a quarter-long slumber on April 1, 2025 would be forgiven for confusing the headlines for an April Fools’ Day prank. They would scan the news and see stories about:
• large tariffs alternately announced, rescinded, delayed and reintroduced at a breakneck pace (see LaSalle Macro Quarterly, or LMQ, p. 4); • US equities in correction territory as ex-US markets, including even China’s, outperform (LMQ p. 25); • increasing calls that the risk of a US recession is rising (LMQ p. 20); and • substantial upward revisions in forecasts of long-term European GDP growth (LMQ p. 21).
Each of these is at least partly (and in some cases completely) contrary to expectations from the beginning of this year. But the quick reversal in the economic narrative is no April 1st joke. The post-election consensus of a supercharged US economy pulling ahead of the rest of the world has clearly been challenged, if not upended.
In this period of elevated policy uncertainty, real estate investors should focus on what they can and should do amidst all the noise. At the risk of stating the obvious, we think it helps to take a step back and break down the analysis into three basic steps of incorporating news flow into investment strategy — the what, the so what, and action steps. But as we will discuss, the first two are characterized by so much uncertainty that it is also helpful to start from the end and work backwards, asking: What can investors do to improve their chances of successfully navigating this environment regardless of what happens?
1. What’s happening?
Normally, the “what” of political developments and other events is the easy part. But since the US presidential inauguration, the Trump administration has made policy announcements — especially regarding trade and federal employment — at a rapid pace. Some of these seem to have taken even insiders by surprise. Widespread post-election expectations that actual policy would be more measured than campaign-trail rhetoric have proven incorrect.1 Reversals and postponements have also been a regular occurrence.
Adding to the news flow are announcements by other countries. These include the tit-for-tat of retaliatory tariff measures. But there have also been substantial structural shifts, most notably the German coalition agreement to spend more on infrastructure and defense. This news is arguably linked to a realization by European leaders that, given less collaboration with the US, Europe will have to forge its own path to generate economic growth and provide for its security.2 Aside from the break that this represents from the post-World War II order, this change is significant because it is a key driver of higher economic growth expectations for Europe.
The result of all this is a “layering” of announcements that is difficult to digest at once (see our attempt at a timeline at LMQ p. 4). It is even more of a challenge to roll-forward the news into reasonable predictions for subsequent weeks, let alone months. As a result, measures of economic policy uncertainty have risen to levels close to historic highs (LMQ p. 5). Indeed, the implications of the many recent developments on the growth and inflation outlook include first-order effects such as the direct impacts of lower government spending on GDP and higher prices on tariffed goods (LMQ p. 7), but also the second-order effects of broadly elevated uncertainty.
Uncertainty is the enemy of investment decision-making. This applies both to financial investment as well as spending by businesses in plant, property, equipment and digital tools. Empirical research has shown a clear negative relationship between uncertainty and investment.3 If businesses are unsure (as they are today) about the rules of the road — for example, around the basic terms of trade governing imports and exports — they may be hesitant to commit capital to long-horizon projects. At the same time, expectations of lower taxes and less regulation may push them back toward optimism.
Our analysis of recent events comes with a dose of humility. While LaSalle dedicates significant resources to tracking and analyzing the constant flow of indicators and news — as highlighted by the LaSalle Macro Quarterly (LMQ) — we do not purport to have a unique competitive advantage doing so. We would expect that our readers follow a range of news outlets, forecasters and other observers in staying abreast of the news flow and making sense of it.
2. What’s the real estate impact?
We do feel, by contrast, that our experience managing property and data from our portfolio puts us in a strong position to assess the likely impacts of policy developments on real estate. Even in the context of elevated overall uncertainty, we can make several observations with relative confidence.
First, we suspect that a key real estate impact of recent policy trends could be higher replacement costs. Tariffs on construction materials, such as steel, are likely to drive up their price. In addition, a lower level of migration into the US may reduce the supply of construction labor there. Increased European spending on infrastructure and defense could also contribute to higher global and regional materials costs. Higher replacement costs would mean that rents would have to rise more to justify new development, ultimately leading to higher net operating income (NOI) growth. This could counterbalance the impact of macro factors such as a potentially slower economy, as well as property type-specific impacts such as softer demand for housing in the context of muted household formation by immigrants. A simpler way to state this is that real estate can act as an inflation hedge.4
Second, we see value in undertaking granular research to identify potential winners and losers from the current policy environment. This approach can help investors identify real estate that is likely less exposed (or may even benefit from) current trends, while flagging potentially more-impacted market segments. Although the exact mix of government policies remains uncertain, the direction of travel is clear enough in some areas to make a few relative calls. For example, a move away from global free trade could weaken real estate demand related to import-export activities, for example in proximity to ports, while bolstering it in emerging near-shoring hubs.
These sorts of analyses can operate both at the national level, for example by identifying more and less trade-exposed countries (e.g., LMQ p. 9), and at the metro-area level, by examining city-level economic exposures (LMQ p. 10 and 11). One specific economic concentration worth mentioning is that of government employment in Washington, DC. Clearly, job cuts by the newly formed Department of Government Efficiency (DOGE)5 are a risk, but there are mitigating factors such as mandated in-person work; we predict a net negative effect for DC real estate demand, but we have not yet seen much impact on the ground or in the data.
Finally, we note that economic softness comes with mixed effects for real estate. As a long-duration, interest rate-sensitive asset class, it is quite possible that a mild or moderate economic slowdown that leads to lower long interest rates could, in fact, be a positive for real estate values in the aggregate. That said, there are likely to be winners and losers, depending on the relative sensitivity of an asset’s performance to interest rates versus sensitivity to economic growth.6
A bigger risk than a slowdown alone is that of stagflation: weak growth at the same time that sticky inflation keeps rates high. However, most economic research suggests that tariffs represent a one-time upward adjustment to the price level, rather than a driver of a sustained, self-reinforcing cycle of higher inflation;7 as such, central bankers may be more willing to ”look through” the impact of tariffs. So far, a recent softening in 10-year Treasury yields suggests that bond markets agree with that assessment (LMQ p. 26).
3. What should investors do about it?
All this points to avoiding excessive pessimism on the direction of values, while remaining cautious and selective. But being discriminating is not the only thing investors can do. We also advocate for turning the process of incorporating news flow into strategy on its head. Because we know so little about where the dust will settle on many of the policy shifts, let alone the impacts of those shifts, it is also prudent to ”work backwards” from the implementation step. Some of the most prudent actions an investor can take do not depend on the specific geopolitical or policy debate of the week.
A key recommendation in this regard is to build a globally diversified portfolio. That the market narrative has shifted quickly from one of US dominance of global growth, to a more balanced view with Europe gathering pace, reinforces that countries’ trajectories may exhibit lower correlations in a more fractured global economy. Rapid reversals of market narratives can generate significant market volatility, particularly when they are “priced to perfection” as the post-election optimism now appears to have been. Diversification should help to absorb that volatility, while avoiding being “left out” of unexpected positive shifts. A microcosm of this occurred recently in the public REIT market, where post-election euphoria led to what appeared to us a significant underpricing of European listed real estate.
Investors are also likely to benefit from diversification across the capital stack, which is why we recommend a permanent allocation to real estate debt. As we discussed in our ISA Focus report, “Investing in real estate debt,” debt investment provides low-correlation returns that are by definition not sensitive to volatility contained entirely within the first-loss equity position. While the risk of a recession in the next year is debatable but possibly rising, the risk of an eventual recession is always 100% in the long run. A debt allocation can help add stability and predictability to a portfolio’s return regardless of the exact path the economy takes.
LOOKING AHEAD >
• Investors should not get lost in the noise. Our view, expressed in the ISA Outlook 2025, is that we are at the ”dawn of a new real estate cycle.” This call is not dependent on a highly certain or favorable macro context, but rests on observations specific to real estate. These include pricing that has caught up with bond yields, valuations that have caught up with pricing, solid property fundamentals and substantially approved debt availability, among other factors. Neither a booming economy nor falling rates are necessary conditions for a revival in investment activity or the existence of attractive investment opportunities.
• There will likely be both winners and losers among specific real estate strategies. Granular analysis of risks and mitigants should inform revised assessments of relative value. To get these shifts right, investors must continue to ask: What is priced in? Overreactions are possible, which can create opportunities for investors to take advantage of volatility.
• Near-term uncertainty can distract from a longer-term picture that is arguably clearer. Over a horizon of years and decades, trends toward higher trade barriers and a more fragmented world seem likely to continue. Moving from a global economy where countries with a comparative advantage in producing a particular good do so and sell it to other countries, to one in which trade barriers create more siloed supply chains, would likely have complex effects. Classic economic theory suggests that transition could hinder productivity. But it could also spur real estate demand as productive capacity and inventories are un-pooled and duplicated. Correlations between real estate markets could also decrease. Investors should be ready to build portfolios with these dynamics in mind.
Footnotes
1 We made this mistake as well, saying that “legislative obstacles exist to enacting full campaign-trail rhetoric” in our November 11, 2024 ISA Briefing, “The ‘Red Sweep’ and real estate: has the outlook changed?”. 2 Source: Signum Global Advisors, Piper Sandler, Oxford Economics 3 According to analysis by Piper Sandler, there is an inverse correlation of -42% between a sustained upward shift in policy uncertainty (as measured by the US Economic Policy Uncertainty Index) and GDP growth; a doubling of uncertainty over a quarter is consistent with -1.5% real GDP growth over the following year. For academic work on this relationship, see Baker, Bloom and Davis, 2016 4 For more discussion of real estate’s role as an inflation hedge, see LaSalle’s ISA Portfolio View. 5 DOGE is seeking to quickly remodel the US government to be more effective at a lower cost. If successful, the project could contribute to the US economy’s productive capacity by reducing the crowding-out effect of government spending on private sector activity. Inconveniently, the prospects for reducing government spending face many constraints, not least the fact that a very large proportion of US government spending is committed to entitlement programs like Social Security, Medicare and Medicaid, which most politicians have pledged not to touch. Moreover, in the short term, reduced government employment and lower outlays would directly reduce GDP. Sources: Piper Sandler, Signum Global Advisors 6 In LaSalle’s ISA Outlook 2025, we highlighted our Portfolio Balance framework, which describes real estate market segments according to their historical sensitivities to economic growth and interest rates. The framework segments markets and sectors into four categories: growth-led, rate-led, stable, and reactive. We found that while short-leased, economically sensitive sectors like hotels may see values soften in a recession, other sectors may actually see values benefit if interest rates soften enough. 7 Source: Economic Policy Institute, Federal Reserve Bank of Boston, Piper Sandler
Important notice and disclaimer
This publication does not constitute an offer to sell, or the solicitation of an offer to buy, any securities or any interests in any investment products advised by, or the advisory services of, LaSalle Investment Management (together with its global investment advisory affiliates, “LaSalle”). This publication has been prepared without regard to the specific investment objectives, financial situation or particular needs of recipients and under no circumstances is this publication on its own intended to be, or serve as, investment advice. The discussions set forth in this publication are intended for informational purposes only, do not constitute investment advice and are subject to correction, completion and amendment without notice. Further, nothing herein constitutes legal or tax advice. Prior to making any investment, an investor should consult with its own investment, accounting, legal and tax advisers to independently evaluate the risks, consequences and suitability of that investment. LaSalle has taken reasonable care to ensure that the information contained in this publication is accurate and has been obtained from reliable sources. Any opinions, forecasts, projections or other statements that are made in this publication are forward-looking statements. Although LaSalle believes that the expectations reflected in such forward-looking statements are reasonable, they do involve a number of assumptions, risks and uncertainties. Accordingly, LaSalle does not make any express or implied representation or warranty and no responsibility is accepted with respect to the adequacy, accuracy, completeness or reasonableness of the facts, opinions, estimates, forecasts, or other information set out in this publication or any further information, written or oral notice, or other document at any time supplied in connection with this publication. LaSalle does not undertake and is under no obligation to update or keep current the information or content contained in this publication for future events. LaSalle does not accept any liability in negligence or otherwise for any loss or damage suffered by any party resulting from reliance on this publication and nothing contained herein shall be relied upon as a promise or guarantee regarding any future events or performance. By accepting receipt of this publication, the recipient agrees not to distribute, offer or sell this publication or copies of it and agrees not to make use of the publication other than for its own general information purposes.
Singapore (December 12, 2024) – Asia Pacific macroeconomies and real estate markets are showing signs of potential structural changes and unique cyclical patterns, setting the region apart from global trends.
This is the thrust of the Asia Pacific chapter of ISA Outlook 2025 report just released by LaSalle Investment Management (“LaSalle”). Published every year since 1993, LaSalle’s ISA Outlook is designed to help the real estate industry navigate the year ahead.
This year’s key findings include:
Investors in Asia Pacific real estate must navigate new investments and existing portfolios in a complex environment with signs of structural change and a distinctly different cycle compared to historical norms. These factors could have a combination of positive and negative implications for investors, some of which may only become apparent years later.
Adding to the complex macro environment is the US election result, which could lead to heightened economic uncertainty and periodic capital market volatility. China is particularly vulnerable and, to a lesser extent, Hong Kong. Beyond China and Hong Kong, it is difficult to predict clear winners or losers from the U.S. election result for now. We believe that select real estate markets or sectors could benefit from some supply chain rebalancing. In addition, investors may consider focusing on Asia Pacific real estate markets/sectors that are anchored by domestic demand and domestic capital.
In China, which faces the weakest economic growth and consumer confidence in decades, heightened geopolitical tensions between the US and China, as well as the absence of impactful structural reforms or larger-scale stimulus packages, suggest an extended period of economic weakness. This creates a challenging environment for China’s residential and commercial real estate markets over the next few years.
Japan remains the most liquid market in the region, with inflationary growth prospects. Should the substantial domestic investor base in Japan continue to anchor the real estate capital market, the potential impact of further interest rate hikes can be limited. Nonetheless, it is essential to allow for flexibility and the potential for unexpected outcomes, when evaluating investment opportunities or setting up business plans for existing portfolios in Japan.
In other developed economies of the region, the varying and sometimes contrasting cyclical patterns among major real estate sectors within each country set the region apart from global trends.
Commercial real estate liquidity in Asia Pacific has demonstrated resilience compared to other global regions but is still constrained to varying degrees, except for Japan. The gap between buyer and seller expectations is weighing on liquidity and some investors are adopting a wait-and-see approach. Nonetheless, savvy investors understand that sometimes the best returns come from vintages in the wake of cycle turning points or when signs of structural change emerge.
Where favorable macroeconomic conditions present themselves and as global investment appetite returns, the diversity of Asia Pacific markets and sectors within the region will offer discerning investors a variety of opportunities with a wide range of risk-return profiles.
Five strategic themes are highlighted in the Asia Pacific ISA Outlook 2025:
Multi-family: At a nascent stage, except Japan
The multi-family sector in Asia Pacific is undergoing structural changes, driven primarily by demographic shifts and government policies, with significant potential for institutionalization. This sector offers a range of investment opportunities in a basket of markets except China, although it would take time to fully unlock value in this nascent sector outside of Japan due to unproven liquidity.
Office: Navigate cycle changes vs. potential for structural shifts
Office market performance across Asia Pacific varies significantly. It is increasingly important to consider the timing of entry and exit as well as risk mitigation plans. South Korean, Japanese and Singaporean offices offer strategically selected investment opportunities for investors with different risk and return appetites.
Logistics: Not a clear outperforming sector
The logistics sector shows dispersion in performance across markets, submarkets and sub-sectors. With relatively balanced supply-demand dynamics, Australia, Singapore and select Japanese markets offer investment opportunities, despite reducing return expectations.
Retail: Distinctive consumption patterns
We expect that well-managed retail assets that have adapted their tenant mixes and market positioning in response to changing consumption habits will outperform, adding to operational intensity. A granular, asset-level approach to investment is crucial, given the performance variations across markets and sub-sectors.
Hotel: Momentum mostly priced in, except Japan
The Japanese hotel market is set to continue its growth trajectory, driven primarily by domestic demand and, to a lesser extent, inbound tourists. However, the performance is expected to vary across markets and segments, influenced by the operational capability to navigate challenges such as labor shortages and rising labor costs.
Looking ahead, investors in Asia Pacific real estate must navigate a complex environment marked by structural changes and atypical market cycles.
Elysia Tse, Asia Pacific Head of Research and Strategy at LaSalle, commented: “There are many unknowns in the current complex economic climate, compounded by impending changes in Trump 2.0, which will likely lead to periodic episodes of capital market volatility. Investment strategies that favor domestic tenant demand and domestic capital, as well as those that focus on operational intensity, such as deal execution and in-house leasing, are important for value creation and preservation. In the event of significant dislocation or capital market volatility, investors could seek attractive entry points or creative, structured solutions to address capital stack issues for some troubled property owners or developers.”
Brian Klinksiek, Global Head of Research and Strategy at LaSalle, added: “As we enter 2025, we’re seeing the dawn of a new real estate cycle. While challenges remain, particularly in resolving legacy capital stack issues, we’re observing improving capital market conditions and emerging opportunities across a wide range of sectors and geographies. Investors who recognize these shifts early and act with flexibility are likely to benefit from attractive risk-adjusted returns. However, it’s crucial to remain vigilant about risks on the horizon and avoid the expectation of a rapid return to ultra-low interest rates.”
Ends
About LaSalle Investment Management | Investing Today. For Tomorrow.
LaSalle Investment Management is one of the world’s leading real estate investment managers. On a global basis, LaSalle manages US$88.8 billion of assets in private and public real estate equity and debt investments as of Q3 2024. LaSalle’s diverse client base includes public and private pension funds, insurance companies, governments, corporations, endowments and private individuals from across the globe. LaSalle sponsors a complete range of investment vehicles, including separate accounts, open- and closed-end funds, public securities and entity-level investments.
NOTE: This information discussed above is based on the market analysis and expectations of LaSalle and should not be relied upon by the reader as research or investment advice regarding LaSalle funds or any issuer or security in particular. The information presented herein is for illustrative and educational purposes and is not a recommendation, offer or solicitation to buy or sell any securities or to adopt any investment strategy in any jurisdiction where prohibited by law or where contrary to local law or regulation. Any such offer to invest, if made, will only be made to certain qualified investors by means of a private placement memorandum or applicable offering document and in accordance with applicable laws and regulations. Past performance is not indicative of future results, nor should any statements herein be construed as a prediction or guarantee of future results.
Company news
Jun 18, 2025 LaSalle acquires Ruby Stella Hotel in Clerkenwell
The five-building industrial complex was acquired on behalf of the LaSalle Property Fund.
Feb 11, 2025 Kunihiko Okumura and Steve Hyung Kim appointed Asia Pacific leaders
Keith Fujii to assume the role of Chairman of Asia Pacific, with all changes to be effective July 1, 2025.
Make sure you’ve spelled everything correctly, or try searching for something else. If you still can’t find what you’re looking for, you can always Contact us to talk to someone.
Chicago (December 4, 2024) – US and Canadian real estate is on the verge of a new cycle in 2025, with interest rates down from peak levels and economic growth concerns fading, but also new risks on the horizon, according to the North America chapter of the ISA Outlook 2025 report published by global real estate investment manager LaSalle Investment Management (“LaSalle”).
The landscape for US and Canadian real estate has shifted since last year’s ISA Outlook 2024, which saw lower transaction volumes due to higher interest rates and challenging macroeconomic conditions. LaSalle sees considerable differences between this upcoming cycle and prior ones across both countries. Specifically, interest rates are expected to remain higher, which will lead to a more moderate pace of value recovery. And while the pace of capital flows to real estate is expected to pick-up in 2025, conditions across real estate sectors and markets will remain uneven.
These differences suggest that investing into the coming real estate cycle will not be a simple story of a “rising tide lifts all boats”; selectivity at the sector, market and sub-market level is likely to add value. LaSalle’s ISA Outlook 2025 follows several main themes that will influence real estate decision-making within the US and Canada, as well as sector by sector analysis of different property types:
Economic Outlook – Falling Rates but Risks on the Horizon: While the summer and fall of 2024 saw growing optimism among real estate investors, uncertainty around long-term interest rates rose in the fourth quarter of 2024. Long bond rates have moved higher, even as the Fed started cutting interest rates and Canada’s central bank has become more aggressive in lowering its policy rate. The recent volatility is a reminder that the goldilocks environment has not returned. Pandemic-era reverberations continue as we adjust to a new normal that includes at least the fear of higher inflation.
Capital Markets – Best Market Entry Points Tend to be Early Cycle: Historically, the best entry points for investors tend to come early in the cycle, and the ISA Outlook predicts that 2025 will be the best year for entry into appraisal-based funds, and second best to 2024 for entry at market pricing. However, the research cautions that unless interest rates fall back to the low levels of the post-GFC period, pricing will not likely enable returns similar to those seen in the early years of previous cycles. Despite expectations for a strong vintage year, the ISA forecasts that transaction volume will grow slowly throughout 2025, as many sellers will delay sales expecting better values and fundamentals for 2026.
Balancing a Portfolio – Real Estate Debt: LaSalle’s ISA Outlook 2025 notes that investors need to weigh the potential upside from allocating to equity vs. the downside protection in a debt position. While today this analysis tends to favor equity, there are still strong reasons for investors to allocate to debt. First, interest rates remain high relative to historic levels, which is a benefit to investors seeking high absolute current cash returns from debt investment. Second, there are structural tailwinds to private real estate debt investment as banks dial back direct mortgage activity in favor of providing cross-collateralized ‘back leverage’ to debt portfolios. Finally, debt is a good source of portfolio diversification as volatility remains elevated.
Distress – The Capital Stack Hangover: LaSalle’s North America chapter of the ISA Outlook indicates that some market segments and assets will remain stressed under any realistic outlook for economic growth and interest rates. Challenged capital stacks will not be cured by lower rates, and the “pretend and extend” approach to distressed assets will eventually require resolution. Distress in the US office sector is rising fast, with US residential and retail seeing some limited distress. In Canada, the number of distressed commercial properties in 2024 is expected to double from 2023 levels, though on a dollar volume basis this is a small fraction of US levels.
Global and North American Property Sector Outlooks
The North America chapter of the ISA forms part of LaSalle’sGlobal ISA Outlook 2025, which analyzes real estate trends across geographies and sectors, and similarly finds the new cycle extends to global real estate markets.
Apartments –In 2025, US apartments will still be dealing with the hangover from a supply boom that followed spiking rents, low cap rates and soaring values in 2021 and 2022. While there are significant market level differences, the ISA 2025’s national view is the hangover will not clear until 2026, while 2025 will be another year to muddle through. In Canada, apartment fundamentals remain strong due to migration-related demand drivers.
Industrial – Industrial performance in 2025 is likely to be favorable in both countries, largely because the supply hangover is already ending, leaving fundamentals better positioned. Secular tailwinds are expected to continue, with e-commerce remaining a demand driver and policies boosting domestic manufacturing a growing benefit.
Retail – Globally, the retail outlook continues to improve after an extended period as the least-favored sector. Across the US and Canada, retail construction is expected to remain very low, making existing supply more attractive, especially for the best centers in growing markets and sub-markets. Rent growth remains moderate as tenants’ ability to bear higher rents is constrained, but entry yields in some retail sub-segments are expected to provide an attractive investment opportunity.
Office – Office continues to generate headlines and remains the most discussed sector. Remote working is expected to continue to negatively impact office demand in both countries, but economic growth will eventually outweigh that negative factor. Across North America, the investability of the office sector is increasing and the focus continues to be on quality.
Richard Kleinman, LaSalle’s Americas Head of Research and Strategy, said: “We are on the cusp of a new real estate cycle both globally and in the Americas specifically. That said, navigating the current environment will require selectivity at the sector, market, and submarket levels. The ISA Outlook 2025 research we’ve released today looks in depth at what is driving trends in North American real estate, and lays out our strategy for the year ahead.”
Chris Langstaff, Head of Research and Strategy for Canada at LaSalle, commented: “Our outlook for Canadian real estate next year resembles many of our global projections, with some important distinctions. Optimism is a bit more contained as economic performance has lagged and there’s been uncertainty around trade policies, but favourable demographics, healthy fundamentals in most sectors and forecasts for improved GDP and job growth in 2025 and 2026 will continue to drive opportunities across markets, including in specialty sectors.”
Brian Klinksiek, Global Head of Research and Strategy at LaSalle, added: “Global real estate sentiment is gradually improving following a long period of negativity and signs are pointing to the beginning of a new real estate cycle. History has shown that investing early in a cycle tends to lead to relatively strong performance. There are still risks on the horizon, however, and investors are advised to focus on diversified strategies that are flexible and broad enough to adapt to a complex and evolving relative value landscape. A comprehensive look at value across a wide range of sectors and markets will be required to build a well-positioned real estate portfolio.”
Ends
About LaSalle Investment Management | Investing Today. For Tomorrow.
LaSalle Investment Management is one of the world’s leading real estate investment managers. On a global basis, LaSalle manages US$88.2 billion of assets in private and public real estate equity and debt investments as of Q3 2024. LaSalle’s diverse client base includes public and private pension funds, insurance companies, governments, corporations, endowments and private individuals from across the globe. LaSalle sponsors a complete range of investment vehicles, including separate accounts, open- and closed-end funds, public securities and entity-level investments.
NOTE: This information discussed above is based on the market analysis and expectations of LaSalle and should not be relied upon by the reader as research or investment advice regarding LaSalle funds or any issuer or security in particular. The information presented herein is for illustrative and educational purposes and is not a recommendation, offer or solicitation to buy or sell any securities or to adopt any investment strategy in any jurisdiction where prohibited by law or where contrary to local law or regulation. Any such offer to invest, if made, will only be made to certain qualified investors by means of a private placement memorandum or applicable offering document and in accordance with applicable laws and regulations. Past performance is not indicative of future results, nor should any statements herein be construed as a prediction or guarantee of future results.
Company news
Jun 18, 2025 LaSalle acquires Ruby Stella Hotel in Clerkenwell
The five-building industrial complex was acquired on behalf of the LaSalle Property Fund.
Feb 11, 2025 Kunihiko Okumura and Steve Hyung Kim appointed Asia Pacific leaders
Keith Fujii to assume the role of Chairman of Asia Pacific, with all changes to be effective July 1, 2025.
Make sure you’ve spelled everything correctly, or try searching for something else. If you still can’t find what you’re looking for, you can always Contact us to talk to someone.
London (November 27, 2024) –Europe’s real estate cycle has reached a new dawn, following a deep capital market correction over recent years, according to the European chapter of the ISA Outlook 2025 report published by global real estate investment manager LaSalle Investment Management (“LaSalle”).
Last year’s ISA Outlook described the beginning of adjustment to the new reality of higher interest rates and challenging macroeconomic conditions. As we approach a new year, the latest ISA Outlook describes how market evidence is crossing thresholds that point to a new cycle. For example, data tracked by LaSalle’s asset managers show, from January 2024 to date, rents for new commercial leases across LaSalle’s European portfolio grew 2.7% relative to expiring passing rent, representing a return to an above-inflation pace.
LaSalle estimates that expected go-forward returns for the overall European property market are at their highest level in a decade. As capital slowly returns to the market and yield spreads exceed long-term averages, the real estate outlook has diverged from the region’s weak pace of economic growth due to a combination of supply barriers and asset quality polarisation.
This year’s report identifies strategic themes for investment in European real estate, which earn the region’s real estate assets an important place in investors’ property portfolios.
Beyond beds and sheds A laser focus on “beds and sheds” has become a market consensus portfolio theme for many real estate investors, yet it is now becoming too simplistic to capture the more complex dynamics of the market.
Today’s ISA Outlook 2025 report uses fair value analysis to zero in on the best opportunities across a range of real estate capital and debt strategies and asset classes. These span all property types – not for the sake of diversification – but because we believe there are specific compelling opportunities that span across property types.
The European chapter of ISA Outlook 2025’s five strategic themes:
Don’t forget a (real estate debt) umbrella: Real estate debt strategies can guard against inclement market conditions. New performance data for European debt funds shows the benefits of preparedness. Debt investors are also taking advantage of the choice between fixed-rate and floating-rate lending positions, and the diversification benefits of investing in both.
Follow the hexagons for logistics: In our Paths of Distribution Score, we have mapped Europe into 158,455 hexagons – scoring each on their centrality, from an occupier perspective, for distributing goods to the most consumers at the lowest cost – and we favour logistics strategies that focus on the top-scoring hexagons within the highest ranked markets in our fair value analysis (in France, the Netherland and Germany).
Retail back on the menu: European retail has been through a deep reset, and select retail formats now look too attractive to ignore. Outlet centres in the UK and Northern Europe offer strong alignment between tenants and operators, while Spanish and French retail parks and convenience shopping centres in the Netherlands can also deliver high income returns.
Master adapters – how Europe’s office markets are different: Europe is leading the office market’s adaptation to hybrid work, as their largely mixed-use, mid-rise character, creates distinctive opportunities. A rebalanced office sector is not a distant next buyer prospect for many of Europe’s markets – it’s happening now. This is evident in return-to-office figures as well as property fundamentals. London City office market vacancy has now declined for five consecutive quarters, driving prime rent growth.
A residential and living smörgåsbord: European residential (or living) is not really a single property type, it is a large collection of sub-sectors with widely varying cash flow profiles, pricing, regulation and target occupiers. There continue to be opportunities, but sector selection is paramount, with PBSA standing out in Spain and Germany.
Global uncertainty but clear opportunities
The European ISA Outlook forms part of LaSalle’s Global ISA Outlook, which finds that the new dawn extends across real estate around the world.
Greater clarity on the direction of interest rates around the world should help drive healing of the capital markets in 2025, with hesitant sellers gaining confidence as pricing starts to come in closer to their expectations.
There have, of course, been significant political developments in the US in recent weeks. The Global ISA Outlook reflects on how the “Red Sweep” may affect the real estate investment outlook and the shape of the dawning cycle, with signals pointing towards marginally higher growth, inflation and rates, but no great change in the overall outlook. LaSalle expects that the US economy remains on track for a soft landing. Equally, the European ISA Outlook considers the potential impact of the US Election in Europe, recognising that a stronger dollar could result in a possible boost in student demand for housing and tourist demand for hotel rooms.
The Global ISA Outlook also identifies areas of concern, with China a significant ‘soft spot’ due to a combination of generationally low growth and liquidity alongside weak property fundamentals. The Chinese government has made significant interventions to shore up the economy, and in recent weeks further stimulus has been implemented to guard against the potential onset of US tariffs on Chinese goods. These factors mean that China is something of a unique case in the ISA Outlook, with less applicability of global trends. Similarly, the Japanese market is experiencing a different cycle to the rest of the world. Japan is in the process of exiting a long period of deflationary risk and rock-bottom rates, so unlike other countries, monetary policy in Japan has a modest tightening bias.
Dan Mahoney, Head of European Research and Strategy at LaSalle, said: “We are seeing a new cycle dawning for Europe’s real estate markets. Today’s Europe ISA Outlook delves into why we believe we are entering a new cycle, evidence of data thresholds crossed, and our strategy for the years ahead. These go beyond simple ‘beds and sheds’ – which is too simplistic to capture the complexity of European real estate today.”
Brian Klinksiek, Global Head of Research and Strategy at LaSalle, added: “Global real estate sentiment is gradually improving following a long period of negativity and signs are pointing to the beginning of a new real estate cycle. History has shown that investing early in a cycle tends to lead to relatively strong performance. There are, however, still risks on the horizon, and investors are advised to focus on diversified strategies that are flexible and broad enough to adapt to a complex and evolving relative value landscape. A comprehensive look at value across a wide range of sectors and markets will be required to build a well-positioned real estate portfolio.”
Ends
About LaSalle Investment Management | Investing Today. For Tomorrow.
LaSalle Investment Management is one of the world’s leading real estate investment managers. On a global basis, LaSalle manages US$88.2 billion of assets in private and public real estate equity and debt investments as of Q3 2024. LaSalle’s diverse client base includes public and private pension funds, insurance companies, governments, corporations, endowments and private individuals from across the globe. LaSalle sponsors a complete range of investment vehicles, including separate accounts, open- and closed-end funds, public securities and entity-level investments.
NOTE: This information discussed above is based on the market analysis and expectations of LaSalle and should not be relied upon by the reader as research or investment advice regarding LaSalle funds or any issuer or security in particular. The information presented herein is for illustrative and educational purposes and is not a recommendation, offer or solicitation to buy or sell any securities or to adopt any investment strategy in any jurisdiction where prohibited by law or where contrary to local law or regulation. Any such offer to invest, if made, will only be made to certain qualified investors by means of a private placement memorandum or applicable offering document and in accordance with applicable laws and regulations. Past performance is not indicative of future results, nor should any statements herein be construed as a prediction or guarantee of future results.
Company news
Jun 18, 2025 LaSalle acquires Ruby Stella Hotel in Clerkenwell
The five-building industrial complex was acquired on behalf of the LaSalle Property Fund.
Feb 11, 2025 Kunihiko Okumura and Steve Hyung Kim appointed Asia Pacific leaders
Keith Fujii to assume the role of Chairman of Asia Pacific, with all changes to be effective July 1, 2025.
Make sure you’ve spelled everything correctly, or try searching for something else. If you still can’t find what you’re looking for, you can always Contact us to talk to someone.
Almost three years after interest rates began to spike leading into the Great Tightening Cycle, the first light of a new real estate cycle is clearly visible on the horizon. As with the start of every new day, however, opportunities and challenges lie ahead. LaSalle’s Research and Strategy team will examine both throughout the course of November and December, as we publish four separate chapters, one covering our global outlook, and three deep-dives covering the outlook for Europe, North America and Asia Pacific. Each chapter can be found alongside an accompanying video conversations with lead authors on the links below.
In the Global chapter of ISA Outlook 2025, we look at how to make the most of this new dawn and the opportunities it may present, but with a watchful eye on ways the new day could go off track. We examine these through four broad themes in this year’s report: the morning sky, the capital stack hangover, the breakfast menu, and the early bird.
We examine each of these concepts in turn, and ask what each means for real estate and they intersect with one another and other key trends.
Make sure you’ve spelled everything correctly, or try searching for something else. If you still can’t find what you’re looking for, you can always Contact us to talk to someone.
While dawn is universal, across Europe it can appear different from each location and every angle. European real estate is transiting inflection points following a deep capital market correction. The INREV ODCE index shifted in the latest quarter from declines to positive after seven down quarters.
Against this backdrop, we share our Impressions of a Rising Cycle in Europe, with a focus on what makes the region different from others across the globe. We also share our five key strategy themes for investors in European real estate for the year ahead.
Make sure you’ve spelled everything correctly, or try searching for something else. If you still can’t find what you’re looking for, you can always Contact us to talk to someone.
The summer and autumn of 2024 saw growing optimism among real estate investors. The belief that the dawn of 2025 would open with sunny skies for the real estate market was driven by falls in interest rates from peak levels, fading economic growth concerns and real estate valuations now more aligned with market transactions.
But with more uncertainty creeping into the picture in late 2024, especially around longer-term interest rates, what we see could be described as a “partly cloudy sunrise.”
Make sure you’ve spelled everything correctly, or try searching for something else. If you still can’t find what you’re looking for, you can always Contact us to talk to someone.
The current real estate cycle in Asia Pacific is not a simple repetition of a typical cycle. While Asia Pacific economies have not been immune to supply chain disruptions and elevated inflation, interest rates and construction costs, real estate capital market liquidity in the region (with the exception of China and Hong Kong) has fared much better than in other parts of the world.
In our view, the varying and sometimes contrasting cyclical patterns among major real estate sectors within each country set the region apart from global trends.
Make sure you’ve spelled everything correctly, or try searching for something else. If you still can’t find what you’re looking for, you can always Contact us to talk to someone.
Published every year since 1993, LaSalle’s annual ISA Outlook is designed to help our clients and partners navigate the year ahead. It brings together smart perspectives and investment ideas from our teams around the world, based on what we see across our more than 1,200 assets that span geographies, property types and risk profiles.
As always, we welcome your feedback. If you have any questions, comments or would like to learn more, please get in touch by using our Contact Us page.
This article first appeared in the Fall 2024 edition of PREA Quarterly
Chris Battista, Senior Product Manager at LaSalle Global Solutions, and Brian Klinksiek, Global Head of Research and Strategy, discuss the value of publicly traded real estate investments.
Investors should consider a holistic approach to the real estate asset class across the “four quadrants.” This means considering opportunities spanning both equity and debt positions on one dimension and both private and public market executions on the other (Exhibit 1). Doing so captures the full gross capitalization of real estate, enhances diversification, and opens opportunities to capture the best relative value. We call this being “quadrant smart” in LaSalle’s recently released ISA Portfolio View 2024, an annual report on portfolio construction.
Allocating between real estate debt and equity investing should be driven by risk appetite, views of relative pricing, and an investor’s broader portfolio considerations. Although debt investing has been quite topical over the past two years and covered by multiple investment managers, including LaSalle (see ISA Focus: Investing in Real Estate Debt), this article discusses the relationship between the public and private avenues to real estate equity investment.
Institutional investors tend to be well versed in private equity real estate investing but less consistent in their approach to the publicly traded side of real estate—even though the public side offers similar characteristics, a broad opportunity set, and often leading signals on the broader market’s direction. This article focuses on how to think about using both sides of the equity real estate investing coin, public and private, to maximize access and potentially improve the overall risk-adjusted return profile.
The impacts of US presidential elections on financial markets and especially real estate are often overstated, as we have pointed out previously (see our ISA Briefing, “Elections everywhere, all at once”). An excessive focus on the news cycle can distract from important ongoing trends that are not ‘new news’, such as a broad global trend toward cooling inflation. Headlines also tend to accentuate differences, rather than commonalities, between outcomes. For example, regardless of the election result, trends favored greater nearshoring, and both US political parties are hawkish on China.
That said, last week’s initial reaction to the election result by the media and markets was significant. Looking beyond near-term noise and volatility, we offer our perspective on what it might mean for real estate over medium- and long-term timescales. This is based on our own analysis, the views of third-party providers,[1] and discussions across our research, investment and leadership teams. We recommend investors keep in mind four observations when considering the election result:
Legislative obstacles exist to enacting full campaign-trail rhetoric. The almost certain ‘red sweep’ outcome (Republican control of the White House, Senate and House of Representatives) should make it easier to pass legislation than under the anticipated divided government scenario.[2]The Republican victory has been labelled a ‘mandate’ by the media, but legislatively, it is not a blank check. The Republican majority in the House will be razor-thin and that means that legislation must be agreed by the full spectrum of Republican legislators, which is not uniformly aligned with campaign promises. This will likely exert a moderating force on what the next Trump administration can do, especially around policies that increase the budget deficit. Republicans will also lack a filibuster-proof majority in the Senate and face likely unified resistance from Democrats in that chamber, limiting probable action on many types of legislation.[3]
A shift toward a higher path of growth, inflation and interest rates is possible, but mostly on the margins. Beyond the moderating impacts of the political process, one reason the delta may not be large is that there are likely offsetting impacts. Commentary has focused on Trump policies that potentially boost the prospects for economic growth, including reduced regulation by federal agencies and tax cuts (e.g., fully extending the expiring TCJA[4] and cutting corporate tax rates). But they may exist alongside policies that could be negatives for growth, such as a reduction of net migration to close to zero, which would stifle household formation. Similarly, there are potential Trump policies that may boost inflation, as well as those that could reduce it. Tariffs, fiscal loosening and reduced availability of low-wage immigrant labor would likely be inflationary. But greater domestic US fossil fuel production may be a counterbalancing deflationary force.
Where does all this leave the path of interest rates, which for the first time in two years have been on a clear easing path? The markets’ reaction to the election is instructive. When the scale of Trump’s victory became clear, the 10-year Treasury yield spiked, but it later eased and ended the week lower than it started. Corporate bond yields, our preferred building block for real estate pricing, felt some upward pressure, but also benefitted from narrowing risk spreads.
Meanwhile, the US Federal Reserve and the Bank of England stayed on course, going ahead with policy rate cuts as expected. This suggests there is no likely near-term change of course by monetary policymakers, and the overall bias towards gradually easing interest rates likely remains intact. However, depending on the net impact to growth and inflation, the decline in rates may be a little less steep and they may settle at a slightly higher level than previously expected. However, the change is not enough to prompt a wholesale change in the outlook.
Real estate sectors are likely to see a complex, sometimes offsetting, mix of impacts. For example, the multi-family sector in the US may face a weaker demand outlook if household formation is lower due to sharply reduced immigration. However, it may also experience less new supply if the construction labor force is constrained. There is similar variation in potential impacts for logistics markets. Trade barriers may lead to more regionalized production, which at the margin could lead to established and emerging manufacturing nodes seeing more demand. Meanwhile, import/export-related locations, such as submarkets near ports and airports, may see less demand. There are also potential, if uncertain, impacts that shape the outlook for entire property types. For example, replicating supply chains across borders could represent a net positive for global logistics demand, even if doing so is economically inefficient.[5]
Net impacts to ex-US real estate are also complex. Geopolitical implications, such as those concerning Israel-Gaza and Ukraine, are difficult to predict and do not likely have major implications for the real estate markets where we invest. Regarding trade,tariff proposals are probably best seen as an opening for negotiation.[6] Europe may face minimal new tariffs if its governments agree to spend more on defense, a key ask of President-Elect Trump. But the outcome of any upcoming negotiations is a guessing game at best, and there is a wide spread of views on the probable impact to Europe of US tariffs.[7] Finally, it is worth analyzing potentially differential impacts across global markets. For example, services are not as likely to be subject to tariffs, reducing the impact of trade barriers on services and consumption-oriented economies like the United Kingdom or Spain, versus goods export-heavy Germany.
Variable impacts on specific markets aside, in our view the case for global real estate investment remains intact. In part, this is because the broader trend toward protectionism, potentially accelerated by Trump’s tariff proposals, could lead to decreased return correlations across countries. National markets may begin to align less with global and more with regionalized or country-specific cyclical patterns. This could increase the potential diversification benefits of global real estate investment, the existing case for which we highlighted in our ISA Portfolio View 2024.
LOOKING AHEAD >
Sitting between equities and fixed income, real estate is a hybrid asset class that combines sensitivity to growth with sensitivity to interest rates. Different scenarios for growth and inflation should be considered in the context of varying sensitivities to each across real estate sectors. In the global chapter of our forthcoming ISA Outlook 2025, we will introduce our new Portfolio Balance framework, which does just that.
The net impact of the US election result on specific real estate markets and sectors depends on a complex interaction of multiple incremental factors, some of them offsetting. The regional chapters of the upcoming ISA Outlook 2025 will provide a more detailed discussion of potential sector- and country-specific election impacts across the markets where we invest. Please have a read!
Footnotes
1 These include Oxford Economics, Capital Economics, Piper Sandler, Signum Global Advisors and Green Street Advisors, among others. 2 Going into election day, major models such as those maintained by the New York Times and Nate Silver pegged the presidential candidates’ chances as a ‘coin toss‘ (50%/50%), but with a high degree of probability of a divided control of government (up to 80%). Divided government is typically characterized by policy stability due to difficulties passing new legislation, limiting the degree of likely policy change. It would have likely reduced the expected delta between a Trump and Harris presidency. 3 US senate rules allow for only certain types of legislation, notably certain types of budget bills under the “reconciliation” process, to be passed without a 60-seat supermajority. 4 The Tax Cuts and Jobs Act was a major tax reform bill passed by the Trump administration in 2017, with many of its provisions sunsetting in 2025. 5 Operations theory suggests that splitting one inventory pool into multiple, regionalized pools would increase the aggregate level of inventory required to achieve the ‘optimal’ safety stock that balances the costs of ‘stock outs’ against the cost of carrying inventory. More manufacturing/production space would probably also be required. 6 This statement and others in this paragraph are based on analysis by Signum Global Advisors, the Economist, the Financial Times, Oxford Economics and Capital Economics. 7 Capital Economics expects just a -0.2% Eurozone GDP drag from new tariffs, while many investment banks say tariffs, if enacted, could represent a -1.5% hit to European GDP growth.
This publication does not constitute an offer to sell, or the solicitation of an offer to buy, any securities or any interests in any investment products advised by, or the advisory services of, LaSalle Investment Management (together with its global investment advisory affiliates, “LaSalle”). This publication has been prepared without regard to the specific investment objectives, financial situation or particular needs of recipients and under no circumstances is this publication on its own intended to be, or serve as, investment advice. The discussions set forth in this publication are intended for informational purposes only, do not constitute investment advice and are subject to correction, completion and amendment without notice. Further, nothing herein constitutes legal or tax advice. Prior to making any investment, an investor should consult with its own investment, accounting, legal and tax advisers to independently evaluate the risks, consequences and suitability of that investment.
LaSalle has taken reasonable care to ensure that the information contained in this publication is accurate and has been obtained from reliable sources. Any opinions, forecasts, projections or other statements that are made in this publication are forward-looking statements. Although LaSalle believes that the expectations reflected in such forward-looking statements are reasonable, they do involve a number of assumptions, risks and uncertainties. Accordingly, LaSalle does not make any express or implied representation or warranty, and no responsibility is accepted with respect to the adequacy, accuracy, completeness or reasonableness of the facts, opinions, estimates, forecasts, or other information set out in this publication or any further information, written or oral notice, or other document at any time supplied in connection with this publication. LaSalle does not undertake and is under no obligation to update or keep current the information or content contained in this publication for future events. LaSalle does not accept any liability in negligence or otherwise for any loss or damage suffered by any party resulting from reliance on this publication and nothing contained herein shall be relied upon as a promise or guarantee regarding any future events or performance.
By accepting receipt of this publication, the recipient agrees not to distribute, offer or sell this publication or copies of it and agrees not to make use of the publication other than for its own general information purposes.
We regularly receive questions about past property market dislocations and what they might tell us about today, such as: Is office the new retail?, Will the 7+ years it took retail to rebalance be a template for office? and Should we be worried about the wave of supply in US apartments?
In our latest ISA Focus report, Rebalancing past and present, we engage in patten recognition across a range of historical episodes of occupier market challenges. We present a framework for how these imbalances tend to be resolved, and discuss the range of structural and cyclical factors that drive rebalancing. We also present a selection of historical case studies from around the world, highlighting the complex nature of the rebalancing process and how it can occur not only at different speeds, but also with “bumps in the road” for investors.
We conclude the report with a refresh of our ISA Focus: Revisiting the future of office, noting in particular that there will be specific investment opportunities that arise as the current rebalancing cycle plays out.
Important notice and disclaimer
This publication does not constitute an offer to sell, or the solicitation of an offer to buy, any securities or any interests in any investment products advised by, or the advisory services of, LaSalle Investment Management (together with its global investment advisory affiliates, “LaSalle”). This publication has been prepared without regard to the specific investment objectives, financial situation or particular needs of recipients and under no circumstances is this publication on its own intended to be, or serve as, investment advice. The discussions set forth in this publication are intended for informational purposes only, do not constitute investment advice and are subject to correction, completion and amendment without notice. Further, nothing herein constitutes legal or tax advice. Prior to making any investment, an investor should consult with its own investment, accounting, legal and tax advisers to independently evaluate the risks, consequences and suitability of that investment.
LaSalle has taken reasonable care to ensure that the information contained in this publication is accurate and has been obtained from reliable sources. Any opinions, forecasts, projections or other statements that are made in this publication are forward-looking statements. Although LaSalle believes that the expectations reflected in such forward-looking statements are reasonable, they do involve a number of assumptions, risks and uncertainties. Accordingly, LaSalle does not make any express or implied representation or warranty, and no responsibility is accepted with respect to the adequacy, accuracy, completeness or reasonableness of the facts, opinions, estimates, forecasts, or other information set out in this publication or any further information, written or oral notice, or other document at any time supplied in connection with this publication. LaSalle does not undertake and is under no obligation to update or keep current the information or content contained in this publication for future events. LaSalle does not accept any liability in negligence or otherwise for any loss or damage suffered by any party resulting from reliance on this publication and nothing contained herein shall be relied upon as a promise or guarantee regarding any future events or performance.
By accepting receipt of this publication, the recipient agrees not to distribute, offer or sell this publication or copies of it and agrees not to make use of the publication other than for its own general information purposes.
One of the most important factors we consider when deciding where to invest capital is the transparency of a real estate market. This encompasses the transparency of market fundamentals and investment performance, as well as:
its legal and regulatory transparency,
the prevalence of listed vehicles,
the transparency of transactions processes, and
the transparency of reporting on sustainability factors.
During times of heightened uncertainty, transparency is more important than ever as a foundation that allows real estate occupiers, investors and lenders to operate and make decisions with confidence.
Our latest ISA Focus report, Transparency and Strategy, explores these factors and their implications for real estate investors. We release this report alongside the Global Real Estate Transparency Index (GRETI) for 2024. GRETI is a joint publication between LaSalle and our parent company, JLL, which is based on a global survey of our extensive network of real estate market experts.
Important notice and disclaimer
This publication does not constitute an offer to sell, or the solicitation of an offer to buy, any securities or any interests in any investment products advised by, or the advisory services of, LaSalle Investment Management (together with its global investment advisory affiliates, “LaSalle”). This publication has been prepared without regard to the specific investment objectives, financial situation or particular needs of recipients and under no circumstances is this publication on its own intended to be, or serve as, investment advice. The discussions set forth in this publication are intended for informational purposes only, do not constitute investment advice and are subject to correction, completion and amendment without notice. Further, nothing herein constitutes legal or tax advice. Prior to making any investment, an investor should consult with its own investment, accounting, legal and tax advisers to independently evaluate the risks, consequences and suitability of that investment.
LaSalle has taken reasonable care to ensure that the information contained in this publication is accurate and has been obtained from reliable sources. Any opinions, forecasts, projections or other statements that are made in this publication are forward-looking statements. Although LaSalle believes that the expectations reflected in such forward-looking statements are reasonable, they do involve a number of assumptions, risks and uncertainties. Accordingly, LaSalle does not make any express or implied representation or warranty, and no responsibility is accepted with respect to the adequacy, accuracy, completeness or reasonableness of the facts, opinions, estimates, forecasts, or other information set out in this publication or any further information, written or oral notice, or other document at any time supplied in connection with this publication. LaSalle does not undertake and is under no obligation to update or keep current the information or content contained in this publication for future events. LaSalle does not accept any liability in negligence or otherwise for any loss or damage suffered by any party resulting from reliance on this publication and nothing contained herein shall be relied upon as a promise or guarantee regarding any future events or performance.
By accepting receipt of this publication, the recipient agrees not to distribute, offer or sell this publication or copies of it and agrees not to make use of the publication other than for its own general information purposes.
Last year, we released the inaugural edition of LaSalle’s ISA Portfolio View, where we discussed the art and science of portfolio construction and why it matters most when market conditions change suddenly. That was certainly true at the time of last year’s release and remains so today.
In this year’s edition, we cover the five foundational concepts of portfolio management below, and how they should be considered alongside an investor’s objectives and values to devise a strategy for their portfolio.
Why real estate lays out the case for property exposure in a multi-asset context?
Why global considers the benefits of expanding horizons beyond an investor’s domestic market?
Why be sector smart tries to make sense of the recent changes in relative sector performance with an eye to building resilient portfolios?
Why be quadrant smart addresses the interplay among the “four quadrants” of real estate?
For 2024, we have also updated ISA Portfolio View to include the most recent available data, and added new sections on:
long-term real estate returns relative to stocks and bonds,
debt returns’ correlation to other assets, and
the effect of leverage on both risk and returns.
The speed and unpredictability of market changes over the last few years highlights the importance of not only planning ahead by thinking carefully about how to create real estate portfolios that can be expected to be resilient, but also working with an asset-class expert who understands the nuances presented by real estate.
This publication does not constitute an offer to sell, or the solicitation of an offer to buy, any securities or any interests in any investment products advised by, or the advisory services of, LaSalle Investment Management (together with its global investment advisory affiliates, “LaSalle”). This publication has been prepared without regard to the specific investment objectives, financial situation or particular needs of recipients and under no circumstances is this publication on its own intended to be, or serve as, investment advice. The discussions set forth in this publication are intended for informational purposes only, do not constitute investment advice and are subject to correction, completion and amendment without notice. Further, nothing herein constitutes legal or tax advice. Prior to making any investment, an investor should consult with its own investment, accounting, legal and tax advisers to independently evaluate the risks, consequences and suitability of that investment.
LaSalle has taken reasonable care to ensure that the information contained in this publication is accurate and has been obtained from reliable sources. Any opinions, forecasts, projections or other statements that are made in this publication are forward-looking statements. Although LaSalle believes that the expectations reflected in such forward-looking statements are reasonable, they do involve a number of assumptions, risks and uncertainties. Accordingly, LaSalle does not make any express or implied representation or warranty, and no responsibility is accepted with respect to the adequacy, accuracy, completeness or reasonableness of the facts, opinions, estimates, forecasts, or other information set out in this publication or any further information, written or oral notice, or other document at any time supplied in connection with this publication. LaSalle does not undertake and is under no obligation to update or keep current the information or content contained in this publication for future events. LaSalle does not accept any liability in negligence or otherwise for any loss or damage suffered by any party resulting from reliance on this publication and nothing contained herein shall be relied upon as a promise or guarantee regarding any future events or performance.
By accepting receipt of this publication, the recipient agrees not to distribute, offer or sell this publication or copies of it and agrees not to make use of the publication other than for its own general information purposes.
This article first appeared in the Fall 2024 edition of NAREIM Dialogues.
LaSalle’s Julie Manning writes about our latest report with ULI that provides an industry-wide framework for commercial real estate to address how physical climate risk data can be used in decision-making and supporting investment performance.
Using data to evaluate physical climate risk
Measuring physical climate risk is of growing importance to institutional real estate managers and their investors, at both the individual property and portfolio levels. Of the $850 billion of commercial real estate assets tracked by NPI, LaSalle estimates $285 billion, or 34%, is situated in high and medium-high climate risk zones in the US.
Increasingly, being able to assess an asset’s risk exposure, and knowing how to price that risk into management strategies, are essential parts of operating a portfolio. While data is key to this assessment, understanding how to leverage the right data is even more important. With so much climate risk data available in the market, how can organizations manage and find data that gives them manageable, impactful and usable insights? And more importantly, what should managers do with these insights?
LaSalle’s Eduardo Gorab, Chris Battista and Matt Sgrizzi discuss the outlook for REITs and ask if listed real estate is about to enter a new “golden era”?
Listed real estate investment trusts (REITs) have faced a tough two and a half years, driven by the rapid tightening of financial conditions (see LaSalle Macro Quarterly, or LMQ, pg. 13). Sentiment towards REITs has been weighed down not only by the higher interest rate environment, but also by constrained bank lending, a barrage of negative headlines about commercial real estate and REIT underperformance relative to the broader equity market. But, as the saying goes, it’s often darkest before the dawn.
The modern REIT period has seen three “golden eras” of REIT investing (see chart below).1 These have been characterized by either a dramatic growth in the REIT market or outsized investment returns versus other asset classes, or both. The Savings and Loan (S&L) crisis spurred what is often considered the birth of the modern REIT era in the mid-1990s. During this period, the number of REITs increased by nearly 50%, while the market cap of that group grew nearly seven-fold. Following the Dot-com bubble, a period where REITs had been significantly out of favor, the REIT market endured a multi-year run of strong absolute performance in which it cumulatively outperformed broader equity markets by more than 300%. The period following the Global Financial Crisis (GFC) saw the rise of dynamic new property sectors in the public market, and another period of outperformance in which REITs led broader equities by 50%.
While each golden era was unique, our analysis finds that each period was preceded by challenging circumstances with four common elements (see LMQ pg. 14). These are:
dislocation of bank lending to real estate;
broad-based negative sentiment around real estate;
underperformance versus broader equities which leads to attractive relative valuation and the potential for renewed outperformance; and
an easing or reset of financial conditions, potentially aided by a central bank easing cycle.
Recent history, marked by a post-pandemic recovery followed swiftly by the Great Tightening Cycle (GTC), presents important similarities to these historical periods of severe market challenges. For instance, real estate bank lending is dislocated. An AI-driven tech frenzy and fears of a generalized “commercial” real estate malaise mean REITs have underperformed compared to equities (see LMQ pg. 22). Meanwhile, signs of an easing or stabilization in financial conditions and a potential global monetary easing cycle are becoming more apparent (see LMQ pgs. 9, 10 and 30).
While history does not repeat itself, it does often rhyme. The presence of those elements in today’s market environment, and the potential for those concerns to flip to opportunities, may foretell the next REIT golden era. We discuss each of these factors in turn.
Challenged real estate lending represents an opportunity for REITs. The past two to three years have been characterized by a significant retrenchment in bank lending to real estate. According to the US Senior Loan Officer Survey (see LMQ pg. 16), the net balance between demand for loans and banks’ willingness to lend points to the widest undersupply of credit in the past ten years, except for during the depths of COVID-19. The shortage is evident in all styles of borrowing, from riskier construction loans to mortgages backed by traditional, defensive apartment assets.
This circumstance presents an opportunity for REITs given their strong financial positions and access to the capital markets. Having learned a painful lesson from the GFC, global REITs went into the GTC with their lowest leverage levels on record (see LMQ pg. 16), and nearly 90% of their debt on fixed rates and an average remaining term of seven years.2 Looking specifically at the US market, the overwhelming majority of REIT borrowing – nearly 80% – is from the unsecured market, at rates that are today almost 100 bps lower than a traditional mortgage. This relative advantage in both access and cost of capital positions REITs to potentially play the role of aggregator and to take market share.
“Commercial” real estate negativity is office-focused, but all real estate is not office. Headlines proclaiming the demise of commercial real estate usually involve a misleading generalization. Professionally managed, income-producing real estate generally should not be conflated with office specifically. It is well known that hybrid work and other factors have harmed office values. Office fundamentals are expected to remain relatively weak,3 with the sector’s growth outlook trailing nearly all other REITs globally. Office landlords will likely need to invest capital aggressively to maintain competitiveness.
These challenging office sector dynamics have unfairly cast a shadow over the broader real estate and REIT universe. In reality, office has over time become a smaller portion of the real estate landscape, especially in the public market; as of the date of this paper, only about 6% of global REITs by market capitalization are office focused (see LMQ pg. 20).4 The public market now offers a diverse sector menu comprising a wide range of dynamic sectors. These include industrial and logistics; forms of rental residential including multi- and single-family rental, manufactured housing and student housing; various formats of healthcare property; and exposure to tech-related real estate in the form of data centers and cell towers. Sectors other than office comprise the overwhelming majority of the public REIT market,5 and many of those sectors have growth outlooks that are forecast to produce earnings growth that is in line with or better than broader equities.6 That growth outlook is underpinned by a combination of secular demand drivers and declining supply levels, the other side of the higher interest rate coin.7
Media coverage naturally tends to focus on the national and trans-national arenas, but local political developments can be especially impactful for real estate investments. Such issues can fly under the radar, especially given many of the most relevant ones are only of interest to a specialist audience. For example, changes in policy around topics like the planning process, property taxes and transfer taxes (a.k.a. stamp duty) can have direct, measurable and immediate impacts on property cash flows and thus values. The distraction of the bright shiny lights of global geopolitics should not be allowed to excessively overshadow the critical local issues that impact real estate.
Underperformance may set the stage for a return to outperformance. The negativity around lending or financing concerns and the “death of office” have weighed on both the absolute and relative performance of REITs. The chart below shows the rolling one-year relative performance differential between REITs and equities; it indicates that REIT underperformance has reached its typical peak historical level before starting to reverse. Periods of underperformance have historically tended to reverse, and this instance is likely no different; indeed, the performance gap is already narrowing.
The start of a global monetary easing cycle. Real estate is a capital-intensive business that exhibits significant sensitivity to changes in financial conditions, an observation that holds for both directions of interest rate change. The downside of this dynamic was evident for much of 2022 and 2023, but the upside is likely coming into play. A global monetary easing cycle is now decidedly underway, heralded by the Fed’s 50 bps rate cut on September 18 (see LMQ pg. 31). REITs have generally performed well in periods leading up to and following a central bank easing cycle, as the chart below shows.
Over the past 25 years, REITs have produced total returns of 8% per annum, with 4-5 percentage points of that return coming from income. LaSalle’s base case underwriting for the next three years is for the REIT market to produce total returns of 9%, slightly above historical averages, with roughly four percentage points of that coming from income. That base case forecast incorporates today’s fundamental outlook and interest rate levels. Should any further easing in financial conditions occur, even only in the amount of 50 bps or 100 bps, those return expectations increase to 13% and 18% per annum, respectively, in line with previous “golden eras.”
LOOKING AHEAD >
Pattern recognition is a useful approach that can help in predicting regime shifts in market conditions. Our study of historical periods of listed REIT under- and outperformance identifies a clear pattern. Namely, there are four common factors that have driven REIT strength after a period of challenges: dislocated bank finance, weak sentiment, underperformance versus broader equities, and the start of an easing in financial conditions.
We also identify three historical “golden eras” for REITs — all of which were preceded by periods characterized by those four factors. These periods are those immediately in the wake of the S&L crisis, the Dot-com bust and the GFC.
The current environment resembles the set up for these historical golden eras, suggesting that the REIT market may be on the cusp of its next golden era of investment, according to our analysis.
Many of the factors supporting the REIT market’s upbeat prospects are also positives for real estate as a whole. For example, an easing in financial conditions has historically been a driver of strong forward REIT returns, as well as those for private equity real estate.
That said, some of the dynamics are more specific to listed real estate markets. For example, REITs’ strong balance sheets and the cost of capital advantage of their unsecured borrowing options versus conventional mortgages positions listed players to seize opportunities.
Footnotes
1 This analysis based on LaSalle Securities analysis of historical macroeconomic, capital market and listed market trends. Source for the REIT performance data cited below are the FTSE Nareit indices. 2 Source for debt pricing comments in this paragraph: S&P Global Market Intelligence, Green Street Advisors, company financial releases, company research and market analysis conducted by LaSalle Securities. 3 There is considerable global variation in office performance, and there are certainly exceptions to this generalization, especially in select Asia-Pacific markets and the higher end of the European office quality spectrum. For more discussion of global office trends, see our ISA Outlook 2024 Mid-Year Update. 4 Source: LaSalle Securities. Percent of companies classified as office focused within the global listed universe defined as the constituents of the S&P Developed REIT, FTSE EPRA Nareit Developed and Nareit All Equity Indices. Sector classifications determined by LaSalle Securities. 5 As measured by market capitalization. Source: LaSalle Securities. Global listed universe defined by the constituents of the S&P Developed REIT, FTSE EPRA Nareit Developed and Nareit All Equity Indices. Sector classifications determined by LaSalle Securities. 6 As based on LaSalle Securities proprietary modelling and consensus earnings forecasts for the Bloomberg World Index, a proxy for broader equity markets. 7 Higher interest rates mean development proformas use higher exit yield assumptions and more expensive development finance. When interest rates are high, all else being equal, the rents required to justify development are higher. 8 Based on proprietary internal LaSalle Investment Management modeling of securities returns. There is no guarantee that such forecasted returns, or any other returns referred afterwards, will materialize.
This publication does not constitute an offer to sell, or the solicitation of an offer to buy, any securities or any interests in any investment products advised by, or the advisory services of, LaSalle Investment Management (together with its global investment advisory affiliates, “LaSalle”). This publication has been prepared without regard to the specific investment objectives, financial situation or particular needs of recipients and under no circumstances is this publication on its own intended to be, or serve as, investment advice. The discussions set forth in this publication are intended for informational purposes only, do not constitute investment advice and are subject to correction, completion and amendment without notice. Further, nothing herein constitutes legal or tax advice. Prior to making any investment, an investor should consult with its own investment, accounting, legal and tax advisers to independently evaluate the risks, consequences and suitability of that investment.
LaSalle has taken reasonable care to ensure that the information contained in this publication is accurate and has been obtained from reliable sources. Any opinions, forecasts, projections or other statements that are made in this publication are forward-looking statements. Although LaSalle believes that the expectations reflected in such forward-looking statements are reasonable, they do involve a number of assumptions, risks and uncertainties. Accordingly, LaSalle does not make any express or implied representation or warranty, and no responsibility is accepted with respect to the adequacy, accuracy, completeness or reasonableness of the facts, opinions, estimates, forecasts, or other information set out in this publication or any further information, written or oral notice, or other document at any time supplied in connection with this publication. LaSalle does not undertake and is under no obligation to update or keep current the information or content contained in this publication for future events. LaSalle does not accept any liability in negligence or otherwise for any loss or damage suffered by any party resulting from reliance on this publication and nothing contained herein shall be relied upon as a promise or guarantee regarding any future events or performance.
By accepting receipt of this publication, the recipient agrees not to distribute, offer or sell this publication or copies of it and agrees not to make use of the publication other than for its own general information purposes.
This article first appeared in PropertyEU’s State of Logistics report
LaSalle’s Petra Blazkova recently joined Property EU’s State of Logistics 2024 conference in Amsterdam to present the firm’s inaugural Paths of Distribution Score research, which gives the ability to compare logistics locations at a micro, market, country and pan-European level.
LaSalle identifies top logistics locations in Europe
Paris and the surrounding Île-de-France region are the top micro-locations for efficient logistics distribution in Europe, according to a new study by LaSalle Investment Management.
The Paths of Distribution study considered over 150,000 micro-locations across the UK and EU, scoring them based on factors like manufacturing output, consumer spending, infrastructure, and labour costs. It also took into account the location of Amazon warehouses and analyzed data from REITs and other real estate databases.
Presenting the results at the Amsterdam logistics event, Petra Blazkova, Europe head of Core and Core-plus Research and Strategy, LaSalle Investment Management, pointed out that the data provides valuable insights for investors seeking the most efficient and attractive logistics locations with the greatest potential for long-term rental growth.
A prudent person sees trouble coming and ducks. A simpleton walks in blindly and is clobbered. — Proverbs 22:3
King Solomon’s words of wisdom have been passed down to us for 3,000 years. They still resonate, especially in this modern translation,1 even though the “trouble” is no longer invading Assyrians or Babylonians but the type of danger we bring on ourselves through an all-too-human combination of ingenuity, hubris and ignorance.
Watch any movie from the 1930s to the 1960s and you will see actors inhaling tobacco smoke with abandon. We know better now. Like the generational awareness of the harm caused by tobacco products, real estate owners have gradually become aware of the dangers lurking in certain building materials and contaminated soil. Starting in the 1960s, societies have spent fortunes cleaning up “miracle products.” Asbestos, PCBs, dry cleaning solvents, herbicides and lead pipes were all considered state-of-the-art technologies at various points in human history. None of these inventions were designed with the intention of killing people. They all started with a noble purpose – whether suppressing catastrophic fires, insulating transformers, cleaning wool suits or producing a pleasing nicotine buzz that also curbed the appetite. The “externalities” associated with societal damage from the use of these products took decades to discover and billions to eradicate.
Greenhouse gas emissions share a common ancestry with these miracle products. Heating buildings with diesel fuels, running gas lines through city streets, producing electricity with coal-fired plants—these were all logical, economical, and sensible solutions to the problem of bringing energy to homes, businesses and buildings of all types. The industrial revolution accelerated the growth of cities and raised the quality of life for millions of people by dragging them out of rural poverty. As we now know, society’s dependence on fossil fuels creates new problems which must be dealt with.
The recognition that miracle products can carry hidden (or not so hidden) dangers follows a predictable pattern. Here is what the step-by-step process often looks like:
Evidence and awareness. An environmental problem often requires decades of scientific study and mountains of evidence to convince people that a change is necessary. Even as this evidence accumulates, vested interests organize counterattacks to convince society that the problem is non-existent or over-stated. Eventually the harm to human life becomes so obvious that denial becomes a “fringe position.”
Market demand. In many cases, the process of partial “market adjustment” can begin ahead of government action. Voluntary data collection and industry-led reforms start the slow process of change. In the case of greenhouse gases, the marginal contribution of each emitter is so small, and so embedded in society, that government interventions sometimes lag market-led shifts (e.g., the adoption of LED lighting or heat pumps).
Regulatory response. Yet, government interventions are almost always needed to accelerate and complete behavioral change to truly eliminate harm to the environment and to human life created by “externalities.” These regulations and policy responses often get pushback as competing outcomes are debated in the political arena. Economists agree that putting a price on carbon would be the most efficient and effective solution, but a market mechanism for carbon pricing requires government intervention — in the form of a carbon “tax” or to set up an emissions trading scheme.
Benchmarks and best practices. Eventually, the rise of data benchmarks and peer group comparisons begins to shed light on who, where and how successful “treatments” are applied to any environmental problem. Engineering and laboratory science helps inform this stage of the process, as does public health or industry group data. Integration with market investment processes and decisions leads to a focus on reversing years of damage to the environment and compliance with new regulations and guidelines. At this stage, market-driven and regulatory-driven changes start to converge.
Price integration. Feedback loops are established where type 1 errors (false positives) and type 2 errors (false negative—or overlooked problems) are exposed.2 In loosely regulated situations like climate change, the efficient market hypothesis (EMH) takes hold as the change process gets partially or fully priced by consumers and producers. Economists and policy analysts favor the practice of placing a “price” on an externality to compensate society for the harm. In practice, though, compensatory payments to offset environmental damage are often decided through the courts and litigation.
Continued market and regulatory evolution. The enforcement of tighter regulations also follows its own trajectory depending on the governance structure of a particular country or urban jurisdiction and the toxicity of the problem. The discipline of epidemiology, using population data and public health analysis, is especially helpful at this stage of refining the policy solutions.
The Transition from “Data” to “Wisdom”
For the de-carbonization of buildings, various markets and countries are well into Step 3 (Regulatory Response) and Step 4 (Benchmarks and Best Practices). In Europe the “theory of change” is focused more on EU-wide or national policies to promote energy disclosures through top-down regulatory solutions. In the United States, the emphasis is based more on voluntary pledges, market solutions and regulations that are based on specific local jurisdictions. In most developed countries, steps 5 (Price Integration) and 6 (Market and Regulatory Evolution) are underway, but both have a long way to go.
The rise of real estate sustainability benchmarks (like GRESB) has accelerated in recent years. In many cases, they have expanded to include social factors and tenant well-being alongside environmental metrics. The next hurdle, though, is to establish materiality tests that infuse meaning, and determine financial impacts based on the volumes of reporting that the industry has started to produce and disclose.
Reading through sustainability reports often reveals the triumph of reporting and public relations over salience or relevance. The conjoint challenges of reducing building emissions alongside improving the well-being of building users and the surrounding communities can be obscured by data denominated in less familiar metrics like tons of CO2 or Kilowatt hours. In time, and with experience, the emphasis will shift to what truly moves the needle on all elements of the “sustainable investing” paradigm—and which metrics give off misleading or meaningless “virtue” signals.
Financial metrics align most closely with the “fiduciary duty” of an investor. Moreover, stakeholders have decades of experience analyzing and interpreting financial data. It will take additional time and effort to convert environmental data into financial terms or to simply raise the consciousness of how to interpret energy and emission data in its own right. (LaSalle’s work on the “Value of Green” synthesizes studies of the evidence linking sustainability metrics and financial outcomes. An update on this work is below.)
In writing Proverbs, King Solomon gathered centuries of wisdom based on experience. In the modern world, we often believe that the steps to wisdom are built on a foundation of knowledge, information, and data. The famous “DIKW” hierarchy has been a mainstay of information sciences since the 1930s. Sustainability wisdom is still in the process of being formulated and likely requires more time to make progress. Fortunately, the foundations of this wisdom are already being put in place—first through data (the modern way to refer to many, many experiences), then information (organized and analyzed data), eventually leading to knowledge (patterns are identified and the “what” and “why” questions are answered) and finally reaching the status of accumulated wisdom (how to respond). This is a path that humans have traveled before. More lives are at stake this time around and the wisdom may not be easily agreed upon by all industries, countries and stakeholders. Nevertheless, the search for sustainability wisdom must continue and time is of the essence.
Revisiting LaSalle’s “Value of Green”
In September 2023, LaSalle published our ISA Focus report What is the value of green? Looking at the evidence linking sustainability and real estate outcomes. The report presents a framework on how sustainable attributes of properties can be viewed as both as drivers and protectors of value, along with showcasing findings from the broader literature. We continue to maintain a Value of Green tracker, monitoring research on this subject as it is produced. Some of the findings that have surfaced since the release of our initial report are worth highlighting:
In early 2024, CBRE reported in their UK sustainability index that efficient properties outperformed inefficient properties by close to 2% per year in terms of total return, over the course of 2023 across three major property types. The efficiency of buildings was delineated through EPC ratings.
UBS reported in late 2023 that a green premium of 28% and 19% in price per square foot was in evidence in the New York and London office markets, respectively, when comparing office transactions based on LEED/BREEAM certifications. This premium was also established in cap rates, showing a 36 and 27 bps premium for New York and London respectively.
MSCI published a report on price premiums for green buildings, and how they have changed over time. Looking at offices in Paris and London, a clear trend emerged from 2019 onwards showing a growing sale-price gap between offices with and without sustainability ratings. In the case of London, the gap was close to non-existent before 2019 and had since grown to 25% as of the latest reported data point in late 2022.
Beyond the direct links between sustainability and historical investment performance in terms of return, rent and value premiums, more signals are emerging as available data on the topic grows, and becomes increasingly forward looking:
In 2024, JLL published in their “Green Tipping Point“ report on how the supply/demand balance is shifting in favour of sustainable offices across the globe, as tenant demand evolves. JLL projects a 70% unmet demand across 21 global office markets.
Beyond results based on backward-looking data, detailed case studies of investments into sustainable initiatives are being published. The JLL report “Future-Proof Your Investments“ showcased opportunities for sustainable New York offices; another example is CBRE’s report “The impact of on-site rooftop solar on logistics property values.”
Sources: CBRE (March 2024) UK Sustainability Index Results to Q4 2023. CBRE P. Torres, G. Bolino, P. Stepan (2024) The Green Tipping Point. JLL T.Leahy (2022) London and Paris Offices: Green Premium Emerges. MSCI P. Torres, J. del Alamo (July 2024) Future-proof your investments. JLL D. Marina, J. Tromp, T. Vezyridis, O. Bruusgaard (July 2023) The impact of on-site rooftop solar PV on logistics property values. CBRE O. Muir, Y. Chen, T. Metcalf et.al (Dec 2023) Green premium: Study of New York and London Real Estate finds strong evidence for a ‘green premium’. UBS
What can we learn from simulations?
The de-carbonization of buildings is taking place in a complex and ever-changing environment. It is a multi-dimensional problem replete with uncertain outcomes, regulatory change, shifting societal norms and markets, and the politicization of sensitive issues.
At the June 2024 MIT World Real Estate Forum, Professor Roberto Rigobon unveiled a “sustainability simulation” game patterned on his pathbreaking work on social preferences for the European Commission. The technique shows how the traditional economic conceit that we make “resource trade-offs” does not accurately capture how humans make decisions when faced with multi-dimensional choices.
In the simulation, the audience was given nine choices for different retrofit projects for a commercial building. Each choice resulted in simultaneous movement across three metrics that the audience had already established that they cared about — changes in NOI (profitability), CO2 emissions, and tenant satisfaction/well-being. The cost of the projects was amortized into the NOI calculations and the other metrics were also calibrated based on actual data from the US.
The simulation showed that a knowledgeable real estate audience rarely solves just for “pure profits” at the expense of tenant well-being or CO2 emissions. The simulation also mimicked reality—where sometimes profitability moves in synch with reduced CO2 emissions and other times it moves it moves in the opposite direction. The simulation was designed to show how the co-movement depends on the local market and the type of de-carbonization project. Tenant well-being and CO2 emissions could be implicitly linked to revenue when and if participants believe that occupancy, rents and capital raising are all interconnected.
Through their choices, the audience tried to optimize across all three priorities at once — leading to an interesting result that revealed their average willingness to “pay” to reduce a ton of CO2 emissions of about $200 ton. Yet, if asked directly how much they would pay to reduce a ton of greenhouse gas coming from a building, it seems unlikely that many would have volunteered to pay that much. This finding also shows how the language of profitability and returns is much more advanced than the metrics and concepts associated with either decarbonization or tenant satisfaction. And that all these metrics are linked, but not fully integrated in the minds of real estate professionals.
Only a few participants in the game focused only on reducing CO2 (at the expense of decent profits). And just a few focused exclusively on profitability at the expense of tenant satisfaction or CO2 emissions. This seems like a reasonable facsimile of what enlightened investors will do — especially when they know that their actions are being disclosed. As we learn more from these simulations, it is possible that policy makers will be able to refine the mix of incentives and regulations that govern the real estate industry.
Jacques Gordon Cambridge, Massachusetts
LOOKING AHEAD >
As we advance through the six stages of market wisdom, sustainable features in real estate move away from purely “virtuous” and toward increasingly meaningful drivers of investment value. As noted in our ”Value of Green” report the challenge for investors is understanding where, when and how sustainability is driving performance, which is highly variable across markets and sectors. Given LaSalle’s global reach, we are well positioned to observe, learn and act to enhance and protect asset values for our clients, and gain and share wisdom in the process.
Markets are shifting towards wider alignment with a more sustainable future, new data and findings are continuously published. At LaSalle we also focus on the data generated within our walls, linking our own initiatives driving sustainability with their associated investment outcomes, bringing our own data and experience into the DIKW hierarchy.
Recognizing the importance of meaningful benchmarks to drive decision-making (Stage 4), LaSalle has been leading an industry initiative to develop an improved solution for decarbonization pathways in the US and Canada, which could be adopted by CRREM and others globally. More meaningful decarbonization pathways will help investors properly measure transition risks and set targets, setting the industry up to make real progress in decarbonizing the built environment.
Evolution over the Six Stages will likely be uneven over time, geography and investor type. This unevenness could provide investors at more advanced stages an advantage over less progressed investors. For instance, an investor who has incorporated a carbon business case into their investment process is at an advantage to appropriately price opportunities. For example, it should help investors identify attractive brown-to-green strategies.
Footnotes
1The Message, translated from the Hebrew scriptures by Eugene Peterson (1993-2002).
2 These are all part of the learning that occurs with any “treatment hypothesis.” The science of public health provides solid evidence to weigh whether the “treatment” is helping, hurting or having no impact on the eradication of the underlying disease. In real estate, a good example of this is the gradual discovery that with certain types of asbestos, it is more dangerous to remove it than to “encapsulate” it in an existing structure. The science of “decarbonization” is still being established to determine whether, for example, the mass production of lithium batteries does as much harm as the burning of fossil fuels. For real estate and climate change, the “treatment” will likely focus on energy efficiency/ decarbonization interventions that are a combination of government penalties/incentives and voluntary actions. The effectiveness of these treatments will depend on compliance, market response, and how well interventions find acceptance through the political process.
Important Notice and Disclaimer
This publication does not constitute an offer to sell, or the solicitation of an offer to buy, any securities or any interests in any investment products advised by, or the advisory services of, LaSalle Investment Management (together with its global investment advisory affiliates, “LaSalle”). This publication has been prepared without regard to the specific investment objectives, financial situation or particular needs of recipients and under no circumstances is this publication on its own intended to be, or serve as, investment advice. The discussions set forth in this publication are intended for informational purposes only, do not constitute investment advice and are subject to correction, completion and amendment without notice. Further, nothing herein constitutes legal or tax advice. Prior to making any investment, an investor should consult with its own investment, accounting, legal and tax advisers to independently evaluate the risks, consequences and suitability of that investment.
LaSalle has taken reasonable care to ensure that the information contained in this publication is accurate and has been obtained from reliable sources. Any opinions, forecasts, projections or other statements that are made in this publication are forward-looking statements. Although LaSalle believes that the expectations reflected in such forward-looking statements are reasonable, they do involve a number of assumptions, risks and uncertainties. Accordingly, LaSalle does not make any express or implied representation or warranty, and no responsibility is accepted with respect to the adequacy, accuracy, completeness or reasonableness of the facts, opinions, estimates, forecasts, or other information set out in this publication or any further information, written or oral notice, or other document at any time supplied in connection with this publication. LaSalle does not undertake and is under no obligation to update or keep current the information or content contained in this publication for future events. LaSalle does not accept any liability in negligence or otherwise for any loss or damage suffered by any party resulting from reliance on this publication and nothing contained herein shall be relied upon as a promise or guarantee regarding any future events or performance.
By accepting receipt of this publication, the recipient agrees not to distribute, offer or sell this publication or copies of it and agrees not to make use of the publication other than for its own general information purposes.
Paris / Île-de-France is home to Europe’s top micro-locations for efficient logistics distribution, according to the inaugural release of the Paths of Distribution score, published today by LaSalle Investment Management (“LaSalle”). The innovative, granular new research gives the ability to compare logistics locations at a micro, market, country and pan-European level, with extensive flexibility for understanding, benchmarking and ranking locations at both micro and macro scale.
The Netherlands, thanks to its immediate access to Europe’s major consumption centres and having one of the crossroads of trade within and into Europe, was identified as the strongest-performing country. The port city of Rotterdam, the key gateway of global trade, ranked second and is joined in the top 20 regional markets by local rivals Amsterdam and the North Brabant region of Breda and Tilburg. Germany, the second-best performing country, provided another five of Europe’s top 20 markets, all in the west of the country, establishing this corner of north-western Europe as a hotspot for manufacturing and transportation. The UK, although separated from continental European logistics markets, placed third in the country standings, with Greater London its highest-ranked logistics market, although the West and East Midlands, the North-West of England (surrounding Manchester) and Kent all placed in the top 20 thanks to their strong infrastructure.
Belgium was fourth best performing, with the Antwerp and Brussels markets ranking seventh and seventeenth respectively. The wider Milan region also scored highly in the rankings, despite comparatively low investment volumes historically, while the Veneto-Verona corridor was another Italian market which scored well, with domestic consumption being the primary driver. Likewise, in Poland, the biggest winners were the Katowice-Krakow corridor and Lodz – ranking above the capital Warsaw – both growing notably in recent years and benefitting from investment in infrastructure and labour availability. LaSalle’s analysis shows there is a positive correlation between Paths of Distribution and logistics take-up, making a connection between current demand and these locations’ potential.
Micro-location and methodology The research is the first of its kind, and takes an innovative, granular approach to its methodology, breaking the continent down into 158,445 10-kilometre hexagons. Each micro-location is scored across four key pillars of manufacturing output, consumer spend, infrastructure quality and the proximity to skilled labour. The model not only factors in demand, but also considers the cost from an operator’s perspective of meeting that demand, using an extensive set of region-to-region road freight transport cost metrics, along with a random forest machine learning model evaluating how extensive and accessible the road network is at the most granular level.
The top scoring micro-location hexagons are in the Eastern Crescent that semi-circles Paris, stretching from the area surrounding the Charles de Gaulle airport in the north, moving south-east through Noisy-le-Grand, then continuing south covering Créteil. This sub-market of Paris benefits from excellent connectivity into Paris, as well as to the wider French market, and further north and east.
Logistics distribution scoring is unlike other city rankings because it is about far more than central cities – entire regions and all the micro-locations within them are potentially efficient places for distribution. So the LaSalle team took a new approach filling in all the gaps in the regions of Europe between cities. The vibrant maps showing location scores across all of Europe highlight the corridors, conurbations, clusters, and crescents which define the optimal locations for modern logistics.
Petra Blazkova, Head of Research & Strategy, Core & Core-Plus Capital, Europe at LaSalle, said: “With continued uncertainty around energy prices and supply chains being disrupted, cost uncertainty is high across the continent for logistics providers. Location is a key variable which distributors can still control, and so it is more important than ever: optimising your choice of location can help minimise exposure to these other risks and protect your supply chain. Today’s rankings demonstrate which areas are best for distributors to try to insulate themselves from those pressures. As investors in the sector, this new insight into the most resilient logistics markets in Europe informs our portfolio composition and asset management.”
The full top 20 logistics markets were as follows:
1 Paris / Île-de-France, France 2 Rotterdam, The Netherlands 3 Frankfurt-Mainz, Germany 4 Milan, Italy 5 Greater London, United Kingdom 6 Rhine-Ruhr, Germany 7 Antwerp, Belgium 8 West Midlands, United Kingdom 9 Madrid, Spain 10 Dortmund, Germany 11 Amsterdam, The Netherlands 12 East Midlands, United Kingdom 13 Stuttgart, Germany 14 North West England (Manchester), United Kingdom 15 North Brabant (Breda-Tilburg), The Netherlands 16 Karlsruhe-Mannheim corridor, Germany 17 Brussels, Belgium 18 Veneto-Verona corridor, Italy 19 Kent, United Kingdom 20 Barcelona, Spain
Ends
About LaSalle Investment Management | Investing Today. For Tomorrow.
LaSalle Investment Management is one of the world’s leading real estate investment managers. On a global basis, LaSalle manages US$84.8 billion of assets in private and public real estate equity and debt investments as of Q2 2024. LaSalle’s diverse client base includes public and private pension funds, insurance companies, governments, corporations, endowments and private individuals from across the globe. LaSalle sponsors a complete range of investment vehicles, including separate accounts, open- and closed-end funds, public securities and entity-level investments.
Jun 18, 2025 LaSalle acquires Ruby Stella Hotel in Clerkenwell
The five-building industrial complex was acquired on behalf of the LaSalle Property Fund.
Feb 11, 2025 Kunihiko Okumura and Steve Hyung Kim appointed Asia Pacific leaders
Keith Fujii to assume the role of Chairman of Asia Pacific, with all changes to be effective July 1, 2025.
Make sure you’ve spelled everything correctly, or try searching for something else. If you still can’t find what you’re looking for, you can always Contact us to talk to someone.
One of our key conviction sectors for real estate investment over the last few years has been logistics. It has been a particular focus of our research, as we seek to identify investment opportunities in prime locations. But with continued uncertainty around variables such as energy prices and supply chains being disrupted, cost uncertainty is high across the continent for logistics providers.
Location, however, is a key variable which distributors can still control, and so it is more important than ever: optimising your choice of location can help minimise exposure to these other risks and protect your supply chain.
LaSalle’s Paths of Distribution Score 2024
LaSalle’s inaugural “Paths of Distribution Score,” focuses on the geography of the European logistics market. This innovative, granular new research gives us the ability to compare logistics locations at a micro, market, country and pan-European level, with extensive flexibility for understanding, benchmarking and ranking locations – and opportunities to deploy capital – at both micro and macro scale. As investors in the sector, this new insight into the most resilient logistics markets in Europe informs our portfolio composition and asset management.
This article first appeared in the Summer 2024 edition of PREA Quarterly
LaSalle’s Global Head of Research and Strategy, Brian Klinksiek, discusses how ex-US investors are viewing the US real estate market.
Foreign investors are an important—if far from dominant—source of capital for US commercial real estate. Since 2010, foreign investors have made up around 12% of total US investment activity, compared with the 30%–60% range for most other major developed markets, according to MSCI Real Capital Analytics (Exhibit 1). However, foreign investors also play a meaningful role as limited partners in funds. According to the PREA Investor Composition Survey, investors from outside the US in 2022 held nearly 18% of the NCREIF Fund Index—Open End Diversified Core Equity (NFI-ODCE) net asset value, a share that has risen steadily from less than 5% in 2012. Moreover, in some phases of the market, offshore capital has acted as the marginal buyer of certain types of real estate, giving an outsize impact on pricing.
Investors broaden their real estate holdings outside their home countries for many reasons, including to diversify, expand the opportunity set, and avoid crowded capital markets at home. The drive to expand globally is especially strong for investors in countries with excess savings in the form of well-funded defined benefit pension systems (e.g., Northern Europe), mandatory retirement savings programs (superannuation in Australia), or sovereign wealth funds (many energy exporters). LaSalle has long been an advocate of “going global”; while not the focus of this article, LaSalle covers the case for global investing in its ISA Portfolio View report.
While traditional banks’ appetite for providing commercial real estate loans has declined, other lenders (including investment management firms such as LaSalle) have moved in to fill the funding gap. As a result, we have recently seen increasing interest from institutional investors in real estate debt.
But what is it about real estate debt that makes it a compelling investment? As the second largest of the “four quadrants” of real estate, it has a value in the US and Europe alone of approximately US $4.5 trillion, representing an enormous opportunity. Real estate debt historically has produced competitive risk-adjusted returns in addition to showing low correlation to other assets.
In our latest research, we examine the three-part case for investment, including:
Real estate debt’s place in institutional portfolios,
The role of non-bank lending, and
The debt opportunity today, which takes advantage of a looming debt funding gap and attractive pricing.
Important notice and disclaimer
This publication does not constitute an offer to sell, or the solicitation of an offer to buy, any securities or any interests in any investment products advised by, or the advisory services of, LaSalle Investment Management (together with its global investment advisory affiliates, “LaSalle”). This publication has been prepared without regard to the specific investment objectives, financial situation or particular needs of recipients and under no circumstances is this publication on its own intended to be, or serve as, investment advice. The discussions set forth in this publication are intended for informational purposes only, do not constitute investment advice and are subject to correction, completion and amendment without notice. Further, nothing herein constitutes legal or tax advice. Prior to making any investment, an investor should consult with its own investment, accounting, legal and tax advisers to independently evaluate the risks, consequences and suitability of that investment.
LaSalle has taken reasonable care to ensure that the information contained in this publication is accurate and has been obtained from reliable sources. Any opinions, forecasts, projections or other statements that are made in this publication are forward-looking statements. Although LaSalle believes that the expectations reflected in such forward-looking statements are reasonable, they do involve a number of assumptions, risks and uncertainties. Accordingly, LaSalle does not make any express or implied representation or warranty, and no responsibility is accepted with respect to the adequacy, accuracy, completeness or reasonableness of the facts, opinions, estimates, forecasts, or other information set out in this publication or any further information, written or oral notice, or other document at any time supplied in connection with this publication. LaSalle does not undertake and is under no obligation to update or keep current the information or content contained in this publication for future events. LaSalle does not accept any liability in negligence or otherwise for any loss or damage suffered by any party resulting from reliance on this publication and nothing contained herein shall be relied upon as a promise or guarantee regarding any future events or performance.
By accepting receipt of this publication, the recipient agrees not to distribute, offer or sell this publication or copies of it and agrees not to make use of the publication other than for its own general information purposes.
“You take the blue pill—the story ends, you wake up in your bed and believe whatever you want to believe. You take the red pill… all I’m offering is the truth.”
– Morpheus to Neo, The Matrix (1999)
We published the global chapter of the ISA Outlook 2024 on November 14, 2023, just before euphoria about a potential ‘V’-shaped property market turnaround emerged. Interest rates fell quickly as financial markets priced in several US Federal Reserve (Fed) rate cuts in 2024. For a time, it looked as though our prediction that it would take a little longer for markets to digest a renewed spike in rates would not age well.
In this Mid-Year Update, however, we look back to find an outlook with an uncanny resemblance to that of six months ago. This is not because nothing has changed, but because the mood has gone full circle. The landscape remains characterized by interest rate volatility, soft fundamentals in some markets, and gaping quality divides, but also by pockets of considerable strength. Another factor that has not changed is that financial conditions (i.e., interest rates) remain the dominant driver of the market, and that political and geopolitical uncertainties are in focus in many countries (see LaSalle Macro Quarterly, or LMQ, pages 4-6).1
In this report, we discuss five themes we see driving real estate markets for the rest of 2024 and beyond. At our European Investor Summit in May, our colleague Dan Mahoney argued that—like Neo in the Matrix—we should take the red pill and endeavor to see the market as it is, not as we’d like it to be. Taking the red pill requires a realistic view on property values. It reveals as unlikely a return to an environment of ultra-low interest rates or uniformly benign fundamentals in the “winning” sectors.
But it does not mean that there will not be attractive investment opportunities. Unlike the bleak dystopia of The Matrix, there are many reasons for optimism, as well as signs that the coming months will come to be seen as a favorable investment vintage. That said, investing successfully will require a balance of big-picture perspective and granular discernment, and a mix of patience and willingness to take risk.
Interest rates – Still no map to the trail
Over the past year, we likened the interest rate path in most markets to a strenuous mountain trek: the relentless climb (2022), the range-bound altitude of an alpine ridge line (H1 2023), the unexpected upward turn in the trail (Q3 2023), and the mountain meadow of cooling inflation and expected rate cuts (Q1 2024). More recently, there have been upward turns in the interest rates trail whenever there have been signs of sticky inflation in the US and other key countries.
One thing is for sure: No map exists for this trail. While interest rates have big consequences for real estate capital markets, they are extremely difficult to predict. We continue to caution investors against overconfidence in their ability to forecast the path of long-term interest rates.
Mercifully, falling rates are not a necessary condition for a robust recovery in real estate transaction activity. Despite interest rates remaining elevated, property markets are already showing signs of finding their footing, such as renewed US CMBS issuance and resilient deal volumes in many markets and sectors.2 A key reason for this is that wherever interest rates have spiked over the past two and half years, especially Europe and North America,3 real estate prices have by now adjusted downward significantly. The relativities between expected returns for real estate and those for other asset classes now look more appropriate than they have in many months; in other words, more of the market is at or near fair value.4
That said, while lower rates are not necessary for real estate capital market normalization, greater stability in rates than we have been seeing would no doubt help. Interest rate volatility is the enemy of a smoothly functioning private real estate transaction market. Excessive movement in borrowing costs during due diligence periods can lead to dropped deals and re-trades. Moreover, when rates are volatile, the conclusions of fair value models are also volatile, impacting both buyers’ and sellers’ assessments of appropriate pricing. Looking at recent trends in the MOVE index,5,6 interest rate volatility appears to be gradually easing but is still elevated relative to recent history (see LMQ page 13).
Increasing stability in rates is welcome, but for now it is reasonable to expect continued strains in real estate capital markets that create both challenges and opportunities. Such conditions can represent favorable entry points for debt investors (lenders), distressed equity players and core investors seeking entry points below replacement
Macro – Deciphering divergence
Over the past half-year, interest rates have been increasingly influenced by widening divergences between near-term growth, inflation and monetary and fiscal policy outlooks. Most notably, the bond yield gap between the US and other markets, especially the eurozone, has widened. US growth and inflation have surprised on the upside, in the face of softening or stability elsewhere. Markets currently expect only one Fed rate cut in 2024, down from up to four earlier in the year.7 Meanwhile, in early June the Bank of Canada became the first G7 central bank to cut rates since the great tightening cycle began, with the European Central Bank (ECB) following shortly after (see LMQ page 7).
Regional groupings can obscure divergences within them. The key driver of eurozone softness is Germany (see LMQ page 23), owing to its reliance on manufacturing exports and past dependance on Russian energy. Meanwhile, the Spanish economy remains strong due to healthy consumption and tourism. Within North America, Canada’s economy is underperforming the US because the structure of its residential mortgage market makes it more exposed to higher rates.8 These intra-regional variations may have a range of impacts on property markets, for example by shifting the relative short-term prospects for demand and value.
Japan and China represent long-standing divergences that persist.9 In China, a loosening bias remains in effect as inflation hovers at around 0%.10 In Japan, monetary policy is gradually normalizing, but so far without triggering a big increase in interest rates (at least compared to elsewhere). In March, the Bank of Japan (BOJ) abandoned negative interest rates and ended most unorthodox monetary policies, though it has since held policy interest rates at around zero. Japan’s economy becoming more “normal” is generally a positive, but interest rate differentials have pushed the yen to a 34-year low against the US dollar (see LMQ page 14), creating upside risks to inflation.11 But notably, Japan remains the one major global market in which real estate leverage remains broadly accretive to going-in yields.
Aside from reinforcing the potential benefits of diversification, what do these divergences mean for investors? Mechanically, any unexpected relative softening of interest rates should, all else equal, be beneficial for relative value assessments of real estate in that market. But firmer rates in the US have predictably come alongside a stronger US dollar. This points to practical limits to global monetary policy divergences; central bankers are keenly aware that weaker currencies come with inflationary risks. Moreover, it is worth asking how persistent macro divergences will be; current divergences are rooted in timing differences of expected rate cuts, rather than an anticipated permanent disconnect.
Renewed cyclicality — Ride the (supply) wave
For several years, secular themes and structural shocks have dominated the trajectories of global property markets. But there is a clear cyclical pattern reemerging in the form of a pronounced upswing in vacancy across global logistics markets, and in US apartments. The return of cyclicality in those favored sectors is having significant impacts on their near-term prospects.
The softening trend is not new. In the ISA Outlook 2024, we identified hot sectors “coming off the boil.” Part of this was down to normalizing demand levels, but elevated new supply was also a key driver. As expected, the softening we observed has continued to deepen, leading to outright rent declines in certain markets, especially for apartments in US sunbelt metros.
Softening fundamentals are not to be ignored, but we recommend investors to have the conviction to “ride the wave” of excess supply. Wide variation in supply levels at the market and submarket level means that investors with granular market data and the discipline to incorporate it into their market targeting processes should be positioned to select the most attractive markets and submarkets.
Moreover, the forces that create cycles sow the seeds of their own reversal; we expect the current supply wave to moderate soon, as evidenced by sharply falling construction starts (see LMQ page 25). Many of the projects being completed today broke ground when credible exit cap rate assumptions were several hundred basis points lower than today. Higher interest rates upended development economics; far fewer new developments can now be justified on today’s mix of land prices, construction costs and financial conditions.
Finally, investors should be prepared to think about cash flows in both real and nominal terms. When cooling nominal rental growth comes alongside cooling inflation, as it does today, it is possible for that to be consistent with solid real rental growth, depending on the relative magnitude of each.
The next chapters in secular change
Beyond the reassertion of supply cycles in some markets, there is an evolving mix of secular stories that deserve attention. Some of these are so long-standing that they could almost be considered constants. These include structural shortages of housing in most of Europe, Canada and Australia, as well as the widespread changing definition of core real estate in favor of more operational niche sectors and sub-types.12 We continue to be strong advocates for investment in undersupplied living sectors, and for participating in the institutionalization and growth of niche sub-sectors such as single-family rental (SFR) and industrial outdoor storage (IOS).
More dynamic themes that deserve a closer look include the stabilization of retail real estate and divergent office investment prospects:
Rebalanced retail — In much of the world, the various sub-sectors of retail are on firmer ground than they have been in years. This owes to a nearly decade-long process of rebalancing, supported by normalizing post-pandemic demand trends and the removal, through demolition or irrelevance, of uncompetitive retail inventory. We have found retail assets to be some of the most stable performers in our portfolio in recent quarters. While the consumer mood is bifurcated between healthy higher-end households and lower-income households struggling with inflation’s hit to real spending power, physical retail has proven its enduring role in serving both convenience and experiential shopping. We are constructive on selective investment in several retail sub-types, particularly European outlet centers, top Canadian regional malls, and select open-air centers in the US.
All-over-the-map office — The office sector is quite literally “all over the map”, with huge variation in outlook depending on geography, ranging from Seoul, South Korea, where office market conditions are currently tighter than nearly any other market/sector combination globally, to the many North American office markets where vacancy rates are well into double digits. We stand by our long-held views13 on the widely varying prospects for global office markets, with Asia-Pacific markets (ex-Australia and China) having the best near-term outlook, US markets having the worst, and Europe in between. One office sector theme that deserves special mention is the increasingly compelling case for investment in super-prime offices in a handful of key European central business districts. We see the conditions for a substantial shortage of top-quality space several markets, which should lead to substantial rent spikes for the best positioned assets.
Other key secular themes driving investment opportunities today include the implications of artificial intelligence (AI) adoption for data center demand, student mobility for student accommodation in Europe and Australia and aging for senior housing.
Don’t wait for the “all clear”
Past experience of real estate cycles suggests that the best investment opportunities tend to arise in periods marked by significant uncertainty, volatility and pessimism, but also when early signs of improvement and stabilization are present—in other words, moments similar to today’s environment. Experience also reinforces that it is nearly impossible to time the market, so it is best to be selectively active throughout the cycle. By the time the “all clear” signal is sounded after a market crisis, it is too late to achieve the best risk-adjusted returns.
That said, “red pill” thinking means we must recognize that the coming capital market rebound is unlikely to be as sharp as it was after the Global Financial Crisis (GFC), given that central banks are unlikely to usher in ultra-loose policy. Seeing the market as it is requires accepting the likelihood that interest rates could remain sticky, and a realistic view of near-term fundamentals as a wave of supply impacts some sectors.
LOOKING AHEAD >
Strategies for both new and existing investments must take a realistic stance on interest rate uncertainty, with duration exposures aligned to an investor’s goals and risk appetite. Using real estate as a vehicle to place bets on bond markets is as inefficient as it is misguided. We continue to recommend that investors be largely “takers” of bond market signals, and today those are pointing to interest rates remaining high for longer in the US and several other key markets.
Upended development economics in many markets and sectors means that assets can be bought well below replacement cost, suggesting rents will need to rise and/or land prices will need to fall to justify incremental supply. While buying below replacement cost can be one indicator of a potentially attractive acquisition opportunity, we are cautious about using replacement costs in isolation as an investment decision-making tool. It is essential to adjust for the capital expenditure required to truly equalize the market position of a new asset versus an old one. Often a building is worth less than the cost to build a new building simply because it is old and uncompetitive.
The anchor of “replacement cost rents” only operates when there is a fundamental need for additional space. In heavily vacant markets, such as US offices, it likely will be years before this mechanism kicks in. Investors acquiring below replacement cost in heavily unbalanced markets must be prepared to wait a long time for that discount to close, and the extended passage of time to monetize a discount is mathematically deleterious to IRRs. A focus on markets working through short-term challenges such as a wave of new supply, but characterized by long-term strength, may generate the best risk-adjusted returns.
Market bottoms are hard to see in the moment, and only tend to become obvious in retrospect many months down the line; it is hard to see today whether we are fully clear of the lowest point in prices. But we have a least moved from a period of relentless upward movement in rates to volatility around a pivot point. Moreover, challenged capital stacks built before the great tightening still need repair. Both observations point to potentially strong opportunities to invest today across real estate debt and equity.
Footnotes
1 Also see our ISA Briefing, “Elections everywhere, all at once: Geopolitics and risk”, April 2024. In that note, we highlighted the various sources of political uncertainty this year and outlined how we recommend investors consider these risks. At the time of writing, political developments are particularly salient for short-term movements markets in France and the UK, given elections that have been called in those countries. 2 Source: MSCI Real Capital Analytics and Trepp 3 Japan and China are key exceptions that we cover in greater depth under the “deciphering divergence” header. 4 Of course, there is considerable variation embedded in this and any assessment of fair value. As always, the devil is in the detail on the assumptions that go into expected and required returns; at LaSalle, specific fair value inputs and conclusions remain a proprietary output. 5 The Merrill Lynch Option Volatility Estimate (MOVE) is a market-implied measure of volatility in the market for US Treasuries. It calculates options prices to reflect the expectations of market participants on future volatility. Observation made as of June 24, 2024. 6 Source: Bloomberg as of June 26, 2024. 7 For more discussion of the Canada-US divergence and the consequences of mortgage rate resets, see our ISA Briefing, ”The impact of residential mortgage resets”. 8 For more detailed discussion of the unique factors in the Japanese and Chinese macro environment, see our ISA Briefing, “Key economic questions for China and Japan”. 9 Source: Oxford Economics; Gavekal Dragonomics as of June 26, 2024. 10 Economic theory suggest that weak currency may contribute to inflationary forces because it pushes up the cost of imported goods. 11 See our PREA Quarterly article on “The Changing Definition of Core Real Estate” for a discussion of how the characteristics considered desirable in core properties is moving from traditional metrics like lease length, to observed qualities like the stability of cash flows. This shift elevates the appeal of niche sectors sub-sectors versus traditional sectors such as conventional office. 12 See our ISA Focus report “Revisiting the future of office”, published March 2023.
Important notice and disclaimer
This publication does not constitute an offer to sell, or the solicitation of an offer to buy, any securities or any interests in any investment products advised by, or the advisory services of, LaSalle Investment Management (together with its global investment advisory affiliates, “LaSalle”). This publication has been prepared without regard to the specific investment objectives, financial situation or particular needs of recipients and under no circumstances is this publication on its own intended to be, or serve as, investment advice. The discussions set forth in this publication are intended for informational purposes only, do not constitute investment advice and are subject to correction, completion and amendment without notice. Further, nothing herein constitutes legal or tax advice. Prior to making any investment, an investor should consult with its own investment, accounting, legal and tax advisers to independently evaluate the risks, consequences and suitability of that investment.
LaSalle has taken reasonable care to ensure that the information contained in this publication is accurate and has been obtained from reliable sources. Any opinions, forecasts, projections or other statements that are made in this publication are forward-looking statements. Although LaSalle believes that the expectations reflected in such forward-looking statements are reasonable, they do involve a number of assumptions, risks and uncertainties. Accordingly, LaSalle does not make any express or implied representation or warranty, and no responsibility is accepted with respect to the adequacy, accuracy, completeness or reasonableness of the facts, opinions, estimates, forecasts, or other information set out in this publication or any further information, written or oral notice, or other document at any time supplied in connection with this publication. LaSalle does not undertake and is under no obligation to update or keep current the information or content contained in this publication for future events. LaSalle does not accept any liability in negligence or otherwise for any loss or damage suffered by any party resulting from reliance on this publication and nothing contained herein shall be relied upon as a promise or guarantee regarding any future events or performance.
By accepting receipt of this publication, the recipient agrees not to distribute, offer or sell this publication or copies of it and agrees not to make use of the publication other than for its own general information purposes.
In 2024 to date, European markets have pivoted through inflection points on interest rates, economic growth, and property capital markets – which we graph and unpeel in our latest LaSalle European Market View chartbook.
Cyclical shifts are interacting with geopolitical risks in 2024 – from trade headwinds to energy and migration demographics – to create volatility and to shape changes in Europe’s occupier demand and investor risk appetite, all as the region stands on the cusp of an unexpectedly active summer election season.
We cover the latest real estate market trends in 2024 to date. Particularly notable is how a combination of moderating inflation and resilient fundamentals has led to an improvement in real – after inflation – market rent growth, even as nominal rent change has come off the boil.
This article first appeared in the Spring 2024 edition of PREA Quarterly
LaSalle’s Global Head of Research and Strategy, Brian Klinksiek, discusses how the definition of core real estate is changing for investors, and what that could mean for their strategies.
A surprising standout as the most conversation-provoking exhibit from LaSalle’s ISA Outlook 2024 is titled “LaSalle’s Changing Definition of Core.” The simple table, reproduced for this article, contrasts a traditional core mind-set against an emerging “new” core mind-set. The former is focused on classic real estate metrics, such as credit quality and lease length, and flatters the property types that tend to score well against them, such as office. The latter is a more evidence-based approach focused on predictability and growth of actual cash flows, a lens that tends to favor the living sectors and niche property types and subtypes, such as medical office.
Taking a step back, the definition of core can be framed in various ways. It may be cast in relation to the other main “styles” of real estate investment—value-added and opportunistic—in that core is supposed to offer lower but safer and more predictable returns than either of those. Defining this with specificity might involve formal labels and thresholds, such as maximum leverage levels and property type characterizations. Assets and portfolios on the correct side of such definitions would be considered core and those beyond them would not be. Of course, financial theory suggests that the fundamental value of an asset should derive from the characteristics of its cash flows, not its conformance with metrics, criteria, and labels. Given that core portfolios are meant to deliver more reliable returns than non-core ones, an understanding of their sensitivity to factors such as economic growth and inflation and their vulnerability to operational challenges should be more important than how they align with some prescribed taxonomy. In this article, I take each of the classic metrics covered in the LaSalle chart and address why a change of mind-set may lead to better core portfolios.
Recognition has grown substantially in recent years that climate risk can shape real estate investment outcomes. This owes to an increasing frequency and severity of loss events,1 surging insurance premiums,2 improving data availability and a mounting reporting burden driven by regulations.3 Investors have had to move quickly from acquiring basic climate risk literacy, to sourcing good quality climate risk data, to most recently, leveraging that data into improved investment decisions. There is a clear and rising likelihood that investors on the lagging edge of this process may underperform.
At LaSalle, we have sought to share insights from our own climate risk journey, combining that with broader analysis of our industry’s climate risk challenges and opportunities. In 2022, we partnered with the Urban Land Institute (ULI) on a report, How to choose, use, and better understand climate-risk analytics, which addressed the difficulties in selecting and evaluating climate data from an ever-changing and increasingly crowded—and sometimes contradictory—data provider landscape. In April, we released a new report with ULI,Physical Climate Risks and Underwriting Practices in Assets in Portfolios,which looks at how investors are taking these data and seeking to make better-informed buying, selling and portfolio construction decisions based on them.
While the joint ULI report takes an industry-wide view, this ISA Briefing looks at the topic through the lens of LaSalle’s own investment process. We present three case studies of our evaluation of climate risk on a regional, market and asset-level scale. These examples – one each from each of our global investment regions – illuminate how we are taking account of climate risk and lay out our views on issues investors should be thinking about.
A broader regional view: wide-scale impacts
In 2023, the US recorded 28 weather/climate disaster events for which losses exceeded $1 billion, the highest recorded number of distinct events exceeding that threshold.4 But of course, these events were not uniformly distributed across the country. To better understand the geographic predisposition of parts of the country to these hazards, LaSalle’s US Research and Strategy team developed two separate climate risk indexes, evaluating current and future climate risk. The indexes encompass a range of climate hazards, such as heatwaves, floods and wildfires, with earthquakes added as a non-climate threat. The current climate risk index harnesses machine learning to scrutinize hyper-local data from the Federal Emergency Management Agency (FEMA). Meanwhile, the future climate risk projections rely on data from the Rhodium Group data set, as analyzed by ProPublica and assuming an RCP 8.5 scenario.5
LaSalle US Current Climate Risk Index – Source: FEMA, LaSalle analysis
Looking at climate risk at a regional scale has been useful in several ways. First, it can accelerate analysis of new opportunities by acting as a “yellow flag,” directing resources early in the underwriting process toward deeper analysis into asset-specific climate risk issues that may turn out to be red flags. Second, regional climate risk can be integrated into market-targeting tools, weighing it alongside other factors that influence real estate performance (for example, demographic variables such as population growth and real estate variables like the prospects for rental growth). To this end, LaSalle has embedded these climate risks scores into our proprietary Target Market Analyses (TMAs). Thirdly, it can help frame inquiry into how metro-level performance factors, such as migration patterns, can interact with climate risk over time.
On that last point, the map appears to beg a question about recent migration trends that have favored the Sunbelt.6 Are people disproportionally moving to at-risk places, and if so, why? An important follow-on question that is germane for investment strategy is whether climate change may eventually cause a reversal of recently observed migration patterns. Indeed, we do observe a discernible, moderately positive correlation7 (+29%) between climate risk exposure and increased migration over the past five years. This pattern holds, and even intensifies, when considering population growth projections for the next five years (+47% correlation).8
The implication is that regions facing severe climate challenges continue to draw new residents. This suggests that environmental risks may not yet be so widely recognized as to shape behavior. That said, a mere 8% of market value within the NCREIF Property Index’s (NPI) apartment asset base is situated in markets we classify as high-risk.9 This suggests the impact in the near-term on institutional real estate investors will be limited, at least until climate change is severe enough to routinely impact markets in the next less risky band, which encompasses 16% of total NPI apartment value.10 Either way, investors looking to the long-term would be wise to consider how people will respond to growing climate hazards in high-risk markets. If a major reaction is that Sunbelt denizens relocate back to the Rustbelt, that could have significant implications for regional economic growth and real estate market prospects.
A market-level view: Evaluating mitigating infrastructure
Below the regional level, it is at the scale of an individual metro area where different degrees of exposure to climate risk can be evaluated with more granularity. It is often at this level where both in-place and planned efforts to mitigate the potential impacts of climate hazards can be identified. As we discussed in our 2022 ULI report, such measures can confound traditional climate risk data if they ignore its impact.
For example, when overlaying LaSalle’s global portfolio with raw data from our climate risk providers, Amsterdam and its broader ‘Randstad’ region stand out as especially exposed to sea-level rise. Not considering any protective infrastructure, we estimate that 52% of Amsterdam and 38% of Rotterdam commercial property would have a significant exposure to severe flood.11
Dutch primary flood defenses
Thankfully, the Dutch have been building dams and levees to protect their low landmass from flooding for centuries.12 Modern infrastructure investment accelerated in the wake of the 1953 North Sea flood – a combination of a severe European windstorm and high spring tide that caused the sea to flood land up to 5.6 meters above mean sea level.13 The ‘Deltawerken’ (Delta Works), now complete, consists of a set of storm surge barriers, locks and dams mainly located in the south of the country. But the Dutch flood defense program extends beyond the Delta Works,14 encompassing almost 1,500 constructed barriers, including more than 20,000 kilometers of dikes, enough to encircle the country over 15 times. In fact, the Delta Works program has evolved into the Delta Programme, a continuous project that take future effects of climate change into account, with a target of 100% of the Dutch population protected by floods not exceeding a 1 in 100,000-year event by 2050.15
The presence of these flood defense programs is of imperative importance when considering the Dutch markets for investments. We find that many climate risk data providers do not adjust for the Netherlands’ formidable stock of anti-flood infrastructure investment which mitigates much of the risk. Investors who act as uncritical “takers” of unadjusted climate risk stats may thus excessively underweight the Dutch market.
An asset-level view
Below the regional and market level, the asset level is where the outcomes of climate hazards have the most direct impact on a building’s structural integrity or the ability to access and operate a property. An asset manager’s actions can directly influence a building’s capacity to withstand climate-related hazards. This tends to be the most impactful when such interventions are made during the design phase of the development.
For example, take the case of a LaSalle logistics development in Osaka, Japan, a city that has historically been vulnerable to flooding due to its geographical location, with much of the urban area made up of flat lowlands that make natural drainage a challenge in the event of tsunamis and heavy rainfall.16 The local city planning assesses the maximum level water could rise above sea level by submarket in the event of a flood. The flood height varies by location while considering additional factors such as the city’s infrastructure (i.e., floodgates and seawalls) and the overall elevation of the submarket. In the case of one of LaSalle’s Osaka Bay logistics developments, the subject warehouse is at a site where water levels could rise to three meters above sea level in the case of a flood.17
Seawalls, ranging in height from 5.7-7.2 meters protect the asset from extreme floods coming from the sea. To further mitigate the flood risk in the case of extreme rainfall or failure of the sea walls, the warehouse is designed with an elevated floor plate that puts the ground level 1.4 meters above mean sea level, and places key building equipment on the second floor, minimizing potential damage to the asset in the event of flood. This effort resulted in a 4.4 meter clearance above sea level (i.e., sea level + 1.4 meter buffer + 3 meters = 4.4 meters), which is above the required 3.5 meters above sea level (i.e., sea level + 1.4 meter buffer + 2.05 meters = 3.45 meters) for the location. In addition, the property management team has been trained and equipped to minimize flood damage on the first floor by closing the doors and shutters and placing sandbags in any gaps. By incorporating considerations to mitigate flood risk when designing the warehouse, the asset is well positioned to support tenants’ business continuity plans in the event of a flood.
Looking ahead
The impacts of an evolving climate need to be considered through multiple lenses, from country or continent spanning impacts, down to the level of individual assets. At all levels it is necessary to understand the interplay between the impact of climate on people, how governing bodies are responding to it, and how asset and investment managers have opportunities to better safeguard their portfolios against climate-related risks.
Investors should use climate risk data, but apply an overlay of judgement, particularly concerning factors that climate risk data providers generally do not incorporate well. A key example of this is the impact of protective infrastructure. Investors should ask: What mitigating infrastructure is currently in place? Over what time horizon is this accounted for in the present time? Are the plans to strength, expand or enhance local infrastructure in the future? Are these initiatives being appropriately funded, to ensure that plans become a reality?
While our collaboration with ULI on two reports is rooted in a desire to help the industry adopt best practices, standardization need note – and indeed should not – be the central goal. In the future, we expect an increasing share of real estate transactions to be at least partly motivated for buyers’ and sellers’ disagreement on the climate risks faced by a property.18 With increasing severity and intensity of climate-related loss events and surging insurance costs, it is our view that players that get climate risk right are likely to outperform those who do not. Having a differentiated climate risk process could lead to differentiated investment outcomes.
Footnotes
1 Source: National Centres for Environmental Information of the National Oceanic and Atmospheric Administration (NOAA). See Billion Dollar Weather and Climate Disasters
2 Source: The Climbing Costs to Insure US Commercial Real Estate, MSCI, November, 29 2023
3 The TCFD framework which has now been absorbed by IFRS’ ISSB, serves as the framework with which other international reporting standards setters seek to align such as the US SEC who voted in favour of The enhancement and standardization of climate-related disclosure, or the UK Government and the Sustainability Standards Board of Japan who will align its disclosure standards with ISSB.
4 According to the National Centers for Environment Information (NCEI). $1 billion threshold adjusted for inflation in historical periods. See https://www.ncei.noaa.gov/access/billions/.
5 RCP refers to Representative Concentration Pathway, a standard for modeling future climate scenarios of greenhouse gas concentration in the atmosphere. RCP 8.5 represents an extreme case scenario. See this Intergovernmental Panel on Climate Change (IPCC) glossary for more detail.
6 For more discussion on this trend, see our recent ISA Briefing, US migration trends and (U)rbanization.
7 Cross-sectional correlation between the LaSalle current climate risk index and the population change in the top 45 US metro areas between December 2018 and December 2023.
8 Cross-sectional correlation between the LaSalle future climate risk index and population change in the top 45 US metro areas between December 2023 and December 2028 based on Moody’s forecast as of February 2024.
9 Source: LaSalle analysis of data from NCREIF, FEMA.
10 Source: LaSalle analysis of data from NCREIF, FEMA.
11 Source: LaSalle analysis of MSCI data.
12 Source: The Dutch experience in flood management: A history of institutional learning
13 Source: The devastating storm of 1953, The History Press
16 See Osaka city – Flood disaster prevention map outline from the Osaka City Office of Emergency Management.
17 Estimates of maximum flood depth are based on historical records of natural disasters such as earthquakes, river floods and tsunamis that have occurred as reported by Japan’s Ministry of Land, Infrastructure and Tourism.
18 A superficial view of markets is that transactions are based on agreement on value. More accurately, buyers and sellers agree on a price, but their willingness to transact is based on disagreement on value. A seller, for example, may have a less bullish view on NOI growth prospects than a buyer. We expect the same disagreement on climate-related risk/reward trade-offs to be increasingly important.
This publication does not constitute an offer to sell, or the solicitation of an offer to buy, any securities or any interests in any investment products advised by, or the advisory services of, LaSalle Investment Management (together with its global investment advisory affiliates, “LaSalle”). This publication has been prepared without regard to the specific investment objectives, financial situation or particular needs of recipients and under no circumstances is this publication on its own intended to be, or serve as, investment advice. The discussions set forth in this publication are intended for informational purposes only, do not constitute investment advice and are subject to correction, completion and amendment without notice. Further, nothing herein constitutes legal or tax advice. Prior to making any investment, an investor should consult with its own investment, accounting, legal and tax advisers to independently evaluate the risks, consequences and suitability of that investment.
LaSalle has taken reasonable care to ensure that the information contained in this publication is accurate and has been obtained from reliable sources. Any opinions, forecasts, projections or other statements that are made in this publication are forward-looking statements. Although LaSalle believes that the expectations reflected in such forward-looking statements are reasonable, they do involve a number of assumptions, risks and uncertainties. Accordingly, LaSalle does not make any express or implied representation or warranty, and no responsibility is accepted with respect to the adequacy, accuracy, completeness or reasonableness of the facts, opinions, estimates, forecasts, or other information set out in this publication or any further information, written or oral notice, or other document at any time supplied in connection with this publication. LaSalle does not undertake and is under no obligation to update or keep current the information or content contained in this publication for future events. LaSalle does not accept any liability in negligence or otherwise for any loss or damage suffered by any party resulting from reliance on this publication and nothing contained herein shall be relied upon as a promise or guarantee regarding any future events or performance.
By accepting receipt of this publication, the recipient agrees not to distribute, offer or sell this publication or copies of it and agrees not to make use of the publication other than for its own general information purposes.
Report Summary: Physical climate risk data can be a powerful tool for managing asset and portfolio risk and returns. Learn what strategies leading firms are using to manage physical climate risks and navigate market challenges. The latest report from the Urban Land Institute and LaSalle Investment Management builds on their previous report, How to Choose, Use, and Better Understand Climate Risk Analytics, to describe how leading firms are leveraging physical climate-risk data in underwriting practices. With insight into asset- and portfolio-level risk becoming increasingly easy to obtain, new challenges lie in effective interpretation and integration of information into investment practices. Relying on research and interviews with industry leaders, this report provides a nuanced exploration of this emergent issue.
Physical Climate Risks and Underwriting Practices in Assets and Portfolios is structured into three sections, each addressing different aspects of the industry’s response to climate-risk data:
Section 1. Explore the current state of the industry, finding that:
• Leading firms actively coach their teams on physical risk. • Regulatory trends affect, but do not motivate physical risk assessment. • Different geographies approach physical with their own level of urgency. • Investment managers tend to focus on fund risk, capital providers on portfolio risk. • Tools to understand and price physical risk are still in a nascent stage of development.
Section 2. Examines the application of climate data in decision making. Key findings include:
• Aggregate physical risk is a screening tool; individual hazard risk is actionable information. • Climate value at risk remains opaque; the utility of the single number offers value but needs increased transparency. • Atypical hazard risk (e.g., flood in a desert) merits increased attention. • External consultants can frequently fill skill gaps, especially for firms with less in-house expertise. • While no predominant timeframe or Representative Concentration Pathway (RCP) emerged as industry standard, the 2030 and 2050 benchmarks were the most commonly referenced time horizon.
Section 3. Assess the impact of physical climate risk on acquisition, underwriting, and disposition practices; finding that:
• Leading firms start with a top-down assessment of physical risk. • Market concentration of physical risk is analogous to other concentration risks—a nuanced analysis is required. • Capital expenditure for resilience projections is a key forecast but rife with uncertainty. • Local-market climate mitigation measures are important to understand but difficult to forecast. • Exit cap rate discount for estimated physical risk is an increasingly commonly used tool, frequently 25 to 50 basis points. • Firms infrequently disclose physical risk but the market needs increased transparency.
Important Notice and Disclaimer
This publication does not constitute an offer to sell, or the solicitation of an offer to buy, any securities or any interests in any investment products advised by, or the advisory services of, LaSalle Investment Management (together with its global investment advisory affiliates, “LaSalle”). This publication has been prepared without regard to the specific investment objectives, financial situation or particular needs of recipients and under no circumstances is this publication on its own intended to be, or serve as, investment advice. The discussions set forth in this publication are intended for informational purposes only, do not constitute investment advice and are subject to correction, completion and amendment without notice. Further, nothing herein constitutes legal or tax advice. Prior to making any investment, an investor should consult with its own investment, accounting, legal and tax advisers to independently evaluate the risks, consequences and suitability of that investment.
LaSalle has taken reasonable care to ensure that the information contained in this publication is accurate and has been obtained from reliable sources. Any opinions, forecasts, projections or other statements that are made in this publication are forward-looking statements. Although LaSalle believes that the expectations reflected in such forward-looking statements are reasonable, they do involve a number of assumptions, risks and uncertainties. Accordingly, LaSalle does not make any express or implied representation or warranty, and no responsibility is accepted with respect to the adequacy, accuracy, completeness or reasonableness of the facts, opinions, estimates, forecasts, or other information set out in this publication or any further information, written or oral notice, or other document at any time supplied in connection with this publication. LaSalle does not undertake and is under no obligation to update or keep current the information or content contained in this publication for future events. LaSalle does not accept any liability in negligence or otherwise for any loss or damage suffered by any party resulting from reliance on this publication and nothing contained herein shall be relied upon as a promise or guarantee regarding any future events or performance.
By accepting receipt of this publication, the recipient agrees not to distribute, offer or sell this publication or copies of it and agrees not to make use of the publication other than for its own general information purposes.
Roughly 60% of the world’s population lives in countries facing major elections in 2024, markets representing 65% of the institutional investable real estate universe.1 Elections are, of course, the cornerstone of the democratic process, which in turn underpins the appeal of the most transparent, investable markets; that said, elections come with the possibility of policy changes that may impact returns. Today’s geopolitical risks, whether they be this continuing election super-cycle (see LaSalle Macro Quarterly, or LMQ, page 4), or the various ongoing conflicts and trade disruptions, prompt important questions about how to manage investment risks related to these themes.
One of the protagonists in the Oscar-winning film Everything Everywhere All at Once says that being “’right’ is a small box invented by people who are afraid.” LaSalle’s risk management philosophy emphasizes optimizing risk/return trade-offs rather than minimizing risk-taking, while recognizing the limitations of point-estimate predictions and base-case scenarios — that is, attempts at “being right.” Today’s geopolitical events are especially likely to confound any forecaster seeking to be exactly right.
How should an investor manage their assets in the context of “unknowables” about which engaging in guesswork is tempting, but being “right” is elusive? What frameworks do we have to mitigate geopolitical risks? We propose six recommendations to keep in mind for investors taking stock of the many elections, and several conflicts, that may impact markets in 2024.
1. Be mindful of the tendency toward overreaction.
There are many examples of ex ante predictions of elections’ investment implications having been overstated. For instance, leading up to the 2016 US presidential election, there were widespread predictions that the US economy would be significantly negatively impacted by Donald Trump’s anti-immigration and protectionist stance were he elected.2 In the event, equity markets rebounded strongly after a short-lived hit and the US economy proved resilient to the changes in rhetoric and policy that came with a new president.3
Looking ahead to the US elections later this year, almost certainly a rematch between Biden and Trump, coverage of the candidates’ differences should be accompanied by awareness of their similarities. Both candidates seek to prioritize domestic production, which could lead to greater levels of on- or near-shoring of supply chains.4 Moreover, election prediction odds (see LMQ page 6) suggest divided control of the two houses of Congress and the presidency is likely; divided government has typically been associated with relative stability in domestic policy, which is generally positive for markets.5 Both of these factors — at least in isolation — point to the potential for news cycle hype to overstate long-term market impacts of this particular election.
2. Consider an asset’s “geopolitical beta.”
Financial theory tells us that systematic risks are undiversifiable.6 Systematic factors are those with significant, far-reaching implications that affect the price of all assets. But financial theory also entertains that different assets may have different sensitivities to the same set of factors; an asset’s “beta” signifies the responsiveness of its price to a given factor. This is a useful way to think about an investment’s sensitivity to political and geopolitical events. For example, a property in a metro area whose economy is heavily driven by government spending would likely have a high sensitivity to political changes. Another example could be that a property located in the Baltic States, ex-Soviet countries on the border with Russia, is likely to be especially sensitive to developments concerning relations between Russia and the West. Investors should be mindful of assets’ expected sensitivities to geopolitics, whether assessed empirically or, as is more often the case given a lack of data, estimated through intuition.
3. Avoid excessive focus on catastrophic risks.
Systemic risks go beyond systematic factors; they involve severe shocks that have the potential to re-align entire markets in unpredictable ways. An example of such an extreme event is the remote but non-negligible potential that today’s so-called “proxy wars”7 escalate into a broader active conflict between great powers.8 The challenge of incorporating such eventualities into investment decision making is not only estimating appropriate probabilities that such events may occur, but establishing ideal strategic responses should they do so. Catastrophic shocks are exceedingly rare and have the potential to create winners and losers in asset markets that are difficult or impossible to predict.9 It may be more fruitful for investors to focus on more incremental — and more likely — eventualities that have the added benefit of being easier to model.
4. Do not neglect local political risks.
Media coverage naturally tends to focus on the national and trans-national arenas, but local political developments can be especially impactful for real estate investments. Such issues can fly under the radar, especially given many of the most relevant ones are only of interest to a specialist audience. For example, changes in policy around topics like the planning process, property taxes and transfer taxes (a.k.a. stamp duty) can have direct, measurable and immediate impacts on property cash flows and thus values. The distraction of the bright shiny lights of global geopolitics should not be allowed to excessively overshadow the critical local issues that impact real estate.
5. Practice diversification but engage in “pattern recognition.”
To a certain extent, political risks can be managed through diversification. This is especially true when they involve isolated events that impact one country or subnational division such as a specific city, province or state.But often political events are part of a broader arc with potentially far-reaching consequences. A smattering of small seeds can grow from obscurity into a thicket. Nothing illustrates this better than the rise of populism, nationalism and protectionism around the world, themes set to dominate elections this year and beyond. The very notion of “globalized nationalism” may sound like an oxymoron, but it has become a fact.10 While diversification is an essential portfolio construction concept that helps manage many types of risk, including political risk, care must be taken to recognize when what may appear to be “specific” risks are part of a broader pattern that is difficult to “diversify away.”
6. Conduct “what if” exercises around potential impacts.
Geopolitical and political risks are difficult to incorporate into traditional financial analysis. We find that thinking through scenarios can be helpful in identifying investment themes that may emerge from geopolitical trends. These can point to strategies to avoid — as well as potential new ones to pursue. The “Looking Ahead” section of this note expands on some of the key themes we have been tracking.
As geopolitical events are difficult to control and plan for, one may conclude, similarly to that same protagonist in the Everything Everywhere film, that “nothing matters.” But uncertainty is no excuse for ignoring geopolitical risks. We do stop short of directly feeding geopolitical themes into our formal risk management program, where the focus is on the specific risks that can actively be managed for our clients.11 However, it remains important to observe and understand macro conditions from a holistic perspective. The work done in our regional research teams — particularly that focused on capital markets, the signals that foreshadow potential inflection points and the local political themes that impact real estate — is critical to this effort.
Looking ahead
We have argued that political and geopolitical risks are difficult to incorporate into investment processes, but that considering “what ifs” can be useful in uncovering relevant investment themes. Below are three potential real estate implications of the current geopolitical backdrop that we are monitoring today:
Policy uncertainty widens the corridor of possible market outcomes, and has been empirically shown to translate into greater volatility in financial markets and decreased investment decision-making in the real economy.12 There are likely impacts on both broader investment at the macroeconomic level, as well as real estate transactions activity specifically. We continually monitor key indicators of policy uncertainty (see LMQ page 7).
Geopolitical factors should be assessed for their potential impact on inflation and monetary policy. To the extent these interrupt cooling inflation trends and thereby slow the rate at which interest rates moderate, there could be an impact on the trajectory of the real estate recovery. For example, continued attacks on the critical Red Sea shipping route (LMQ Page 10) have caused a five-fold increase in the cost of shipping goods from Asia to Europe. Estimates suggest the impact of this is likely small, temporarily adding just 0.3% back to global core inflation in the first half of 2024,13 but it does serve as a reminder of the volatility that geopolitics can trigger.
On a longer timescale, geopolitical fracturing could lead to increased levels of on- and near-shoring and could thus lead to the duplication of supply chains.14 This is less efficient than a fully globalized world where countries’ exports are specialized according to comparative advantage, and is therefore likely to correspond to higher long-term inflation.15 That said, analysis by LaSalle suggests that the localization of supply chains could be beneficial for real estate demand, particularly in the logistics sector and in politically aligned, lower cost markets adjacent to major ones, such as along the Mexico-US border.
Footnotes
1 LaSalle analysis of data from Time and our proprietary investable universe estimates. See LMQ page 5 for more detail.
2 Sources: “What do financial markets think of the 2016 election?” Brookings Institution paper, Wolfers and Zitzewitz, 2016. The article predicted that “a Trump victory would trigger an 8-10% sell-off”. See also “The Consequences of a Trump Shock,” a Project Syndicate article by Simon Johnson, 2016. He predicted Trump’s election would “likely cause the stock market to crash and plunge the world into recession.”
3 On the news of the 2016 election result, Standard & Poor’s 500-stock index initially fell 5% but ended the day up more than 1%, according to Refinitiv. The US avoided a recession until the emergence of the COVID-19 pandemic, according to Oxford Economics.
4 Source: “Biden vs Trump: Key policy implications of either presidency,” Economist Intelligence Unit, 2023.
5 Sources: “What to Expect From Divided Government.” PIMCO article, Cantrill, 2022. According to the article, “the equity markets historically have tended to do well in years of split government.”
6 Source: The Handbook of Risk Management: Implementing a Post-Crisis Corporate Culture. P. Carrel, 2012. “Systematic or market risk refers to the inherent danger present throughout the entire market that cannot be mitigated by diversifying your portfolio. Broad market risks include recessions, periods of economic weakness, wars, rising or stagnating interest rates, fluctuations in currencies or commodity prices, and other ‘big-picture’ issues like climate change. Systematic risk is embedded in the market’s overall performance and cannot be eliminated simply by diversifying assets.”
7 According to the Oxford Dictionary, “proxy wars are the replacement for states and non-state actors seeking to further their own strategic goals yet at the same time avoid engaging in direct, costly, warfare.” Various observers have argued that the Russia-Ukraine and Israel-Gaza conflicts are proxy wars. For example, see “IKs the ware in Ukraine a proxy conflict?” Kings College London report, Hugues (2022).
8 According to a research brief by RAND: “Great power wars — conflicts that involve two or more of the most powerful states in the international system. These have historically been among the most consequential international events.”
9 Source: “What a third world war would mean for investors,” The Economist, 2023. The article highlights the virtual impossibility of positioning an investment portfolio to outperform through prior world wars, even if the investor had correctly predicted that these conflicts would occur.
10 For further discussion of the global spread of nationalism, see “How cynical leaders are whipping up nationalism to win and abuse power”, The Economist, 2023; “Demonizing nationalist parties has not stemmed their rise in Europe,” The Economist, 2022; “The new nationalism,” The Economist, 2016.
11 We do, however, utilize tools that correlate to geopolitical risk. For example, the JLL Global Real Estate Transparency Index (GRETI) supports our monitoring of evolving investment conditions around the globe. Whilst the model does not explicitly consider political risk, the two are inexplicably linked through the inclusion of a number of governance and regulation data points.
12 Source: “A global economic policy uncertainty index from principal component analysis,” Finance Research Letters, Peng-Fei Dai, 2019.
13 Source: “What are the impacts of the Red Sea shipping crisis,” J.P. Morgan, 2024.
14 Source: “The Great Rewiring: How Global Supply Chains Are Reacting to Today’s Geopolitics,” Center for Strategic & International Studies, 2022.
15 Sources: “The business costs of supply chain disruption,” Economist Intelligence Unit, 2021 and “Why Deglobalization Makes US Inflation Worse,” Project Syndicate, Moyo, 2022.
This publication does not constitute an offer to sell, or the solicitation of an offer to buy, any securities or any interests in any investment products advised by, or the advisory services of, LaSalle Investment Management (together with its global investment advisory affiliates, “LaSalle”). This publication has been prepared without regard to the specific investment objectives, financial situation or particular needs of recipients and under no circumstances is this publication on its own intended to be, or serve as, investment advice. The discussions set forth in this publication are intended for informational purposes only, do not constitute investment advice and are subject to correction, completion and amendment without notice. Further, nothing herein constitutes legal or tax advice. Prior to making any investment, an investor should consult with its own investment, accounting, legal and tax advisers to independently evaluate the risks, consequences and suitability of that investment.
LaSalle has taken reasonable care to ensure that the information contained in this publication is accurate and has been obtained from reliable sources. Any opinions, forecasts, projections or other statements that are made in this publication are forward-looking statements. Although LaSalle believes that the expectations reflected in such forward-looking statements are reasonable, they do involve a number of assumptions, risks and uncertainties. Accordingly, LaSalle does not make any express or implied representation or warranty, and no responsibility is accepted with respect to the adequacy, accuracy, completeness or reasonableness of the facts, opinions, estimates, forecasts, or other information set out in this publication or any further information, written or oral notice, or other document at any time supplied in connection with this publication. LaSalle does not undertake and is under no obligation to update or keep current the information or content contained in this publication for future events. LaSalle does not accept any liability in negligence or otherwise for any loss or damage suffered by any party resulting from reliance on this publication and nothing contained herein shall be relied upon as a promise or guarantee regarding any future events or performance.
By accepting receipt of this publication, the recipient agrees not to distribute, offer or sell this publication or copies of it and agrees not to make use of the publication other than for its own general information purposes.
Purpose-built student accommodation (PBSA) in Europe ranks as one of our top-conviction sectors for investment in the coming years. No longer deserving of the “niche” label in the United Kingdom, it is already more institutional than any other type of living sectors property in the country and is rapidly maturing in Continental Europe as well. The rise of student accommodation on investors’ buy lists is for good reason. This ISA Briefing will set out why that is so and discuss how the sector stands out in Europe compared with student housing in the rest of the world.
Demand factors
After a brief, pandemic-induced interruption, in-person learning in Europe is back with more students enrolled than at any point in history. Higher education participation rates in the European Union have steadily risen across recent years, reaching an all-time high of 36% for 20-24 year-olds1 in 2021/22, with the same proportion recorded for the UK in 2023.2 A total of 18.5 million students were studying in the EU as of the 2021/22 academic year, with a further 2.9 million in the UK, having grown by 8% and 20%, respectively, over the previous five years.3
Demand for PBSA varies by profile of student. While domestic students are still crucial as a source of demand, particularly in markets where few students commute from home to study, international students are far more likely to reside in PBSA than domestic students (60% more likely to do so in the UK, as an example4). As shown in the chart below, international student mobility has been on a clear growth trend in recent years, with 2021/22 seeing a record number of foreign students in the EU and UK. European students studying outside their home countries elsewhere in Europe is a longstanding feature of the market, facilitated by freedom of movement within the EU, well-established student exchange programs, the rise of English-language courses and Europe’s dense geography.
A key driver of growth has been students from outside Europe. Europe has an outsized number of highly ranked universities relative to its size,5 a prevalence of English-language courses (which are increasingly no longer limited to the UK and Ireland) at a comparatively cheaper cost of tuition and living compared to North America.6 These attributes taken together can explain the sharp rise in non-EU students studying in the bloc, whose numbers have grown 31% since 2016.7 In the UK, the growth has been even faster, at 59% over the same period.8
That said, there are demand-side risks to be mindful of. The demographic outlook for Europe is mixed; forecasts for some countries such as the UK, Spain and Sweden show a demographic ‘bump,’ with the number of university-aged people growing ahead of national population levels. However, in other nations, numbers are forecast to be broadly flat (France) or negative (Germany and the Netherlands). This suggests uneven growth in demand for higher education going forward.9
This mixed demographic outlook will mean greater reliance on international student demand, but there are tentative signs that may also be facing some headwinds. A recent policy change in the UK has removed the right to visas for international students’ family members.10 For now, this change represents tinkering around the edges and is unlikely to have a major impact on demand. It does, however, indicate a directional change in policy aimed at restricting overseas student numbers, presumably in a bid to bring down immigration figures. Such policy changes may incrementally dissuade would-be foreign students from studying in the UK, though demand may shift elsewhere, potentially to the benefit of other European countries. Despite such risk factors, the overriding view is one of positivity for higher education demand in Europe and therefore PBSA.
Supply factors
European student housing should be viewed within the wider context of the region’s housing market. Europe is currently facing a long-term, persistent housing shortage. Housing scarcity is not limited to major gateway cities, but is also the reality within mid-sized cities and even smaller university towns. Since 2010, Europe has built homes at a rate only 40% below pre-GFC levels,11 contributing to rising rents, increasing house-price-to-income ratios and worsening access to suitable housing. Demand for rental housing in cities remains robust, supported by long-term trends of immigration, urbanization and declining home ownership rates; as such, the imbalance between supply and demand is now fully entrenched.12
Students are, like all participants in the housing market, at the mercy of housing supply and demand. Shortages have fed through to the student market, with students finding accommodation increasingly unaffordable. Over the past two years, this has led to sharp growth in PBSA rents, with several UK cities reporting year-over-year growth in the high teens for 2023, and other markets experiencing growth well ahead of previous levels.13 The lack of supply is also leading to students being housed increasingly in unsuitable conditions; stories from the UK of students living in hotels or in completely different cities over an hour travel from campus are a clear symptom of insufficient student housing stock.
New investment in the sector should contribute to resolving the imbalance, but it will be a major challenge to fully close the wide gap between supply and demand. While there are nuances between markets, rising construction and development financing costs are making the delivery of new schemes less economical, evidenced by a sharp decline in the number of residential permits issued in several countries over the past year.14 Furthermore, restrictive planning laws and burdensome safety regulations are lengthening the time it takes for projects to be realized.
These factors inform our positive outlook on the rental housing market in Europe, which carries over into PBSA. The imbalance between supply and demand will likely persist and even worsen, driving very low vacancy and supporting strong rental growth for owners of residential and student housing real estate, or those who can deliver new schemes in those sectors.
Regulation haven
Regulations in Europe can act as a handbrake for residential rents, as we set out in our ISA Briefing, Controlling Interest: Keeping tabs on residential regulations. In nearly all continental European rental markets, rents cannot be increased annually at the landlord’s discretion, with rental levels for in-place tenants typically linked to a backward-looking index. During the recent ‘great reflation’ period, this has meant income from many rented residential properties did not keep pace with inflation. But student housing stands out from more traditional rental housing investments as having a cash flow profile far less impacted by the growth-muting tendencies of regulation.
In part, this is because PBSA often faces less regulation or stands outside of regulatory systems altogether. Students’ nature as transient, temporary residents means that their needs are rarely prioritized by local politicians, particularly compared to those of permanent residents. They typically only stay in a city for a few years, do not have dependents and their rental obligations often come with implicit or explicit parental guarantees. This means that PBSA is targeted for rent controls far less often than the wider rental market. Moreover, zoning and classifications for student accommodation are often distinct from standard rental housing, exempting it from regulations that limit absolute rent levels or restrict annual rental increases. Moreover, regulatory requirements on minimum unit sizes or lease lengths usually do not apply.
Even where regulated, PBSA benefits from its relatively short duration of tenancy. Given the vast majority of students study for 3-4 years, there is far greater annual turnover of tenants compared with the wider residential market. Faster turnover allows for landlords to more effectively mark rents to market levels. This means PBSA rents may better keep pace with inflation, even in jurisdictions where regulations do apply to the sector.
Increasingly mature
The increased maturity of student accommodation is another factor in its favor. The UK is clearly ahead of the rest of Europe in this regard, with a deep, liquid investment market, publicly traded REITs and a large number of established specialist operators. The sector’s wide acceptance from both tenants and investors means that we would consider it a ‘Core’ sector on our ‘going mainstream’ framework, as detailed in our ISA Portfolio View. Elsewhere in Europe the sector is considered more niche, but its growing acceptance means we would consider it ‘Near-Core’ on the same framework. Investment figures support the observation of a varying level of maturity for the sector—UK PBSA has made up 66% of investment volumes annual on average since 2014, despite the EU having 6.4 times the number of students.15
Over time, we expect this to change; the opportunity for investors to take advantage of the structural trends outlined above is likely to drive increased investment in the sector. Countries like as Spain or Italy have PBSA provision rates16 of below 10%, compared to more than 30% in some major UK markets,17 suggesting there is significant scope for delivery of new supply. Cities such as Milan, Madrid and Barcelona all have student populations of over 100,000 and multiple well-ranked institutions, giving them diverse demand bases and making them likely to be key growth markets for the sector in the coming years.
As niche sectors mature, greater liquidity and investor acceptance tends to lead to any yield premium they offer versus traditional sectors narrowing, as investors require less compensation for liquidity and transparency risks; such a pattern has already been observed in UK PBSA. This potential narrowing of yields in European markets is another factor behind our conviction that the sector is likely to offer attractive returns.
Comparisons with other regions
Student accommodation in much of Asia Pacific is still in a nascent stage, with relatively limited PBSA stock, few specialized operators and comparatively little institutional investment. The major exception in the region is Australia, which has characteristics similar to those of the sector in Europe and the UK, but is a number of years behind in its evolution. This suggests a similar path to maturity may lie ahead. Like Europe, Australia benefits from English-language courses at comparatively lower tuition costs than the US, while also offering post-study work visas. As a result, it has an even higher proportion of international students than most major European countries.18 Still, the Australian PBSA sector remains in its infancy as an investable property type. Stock numbers are low even compared to the most immature countries in Europe, with a student-to-bed ratios of 16-to-119 and significantly higher than the UK where it is around 3-to-1.
Traditionally, international students in Australia tap into private rental housing for accommodation. Both the private rental market and the PBSA sector in Australia have experienced tight occupier market fundamentals and experienced double-digit rental growth over the past two years.20 The solid performance has been primarily driven by strong migrant inflows, including international students, as well as high interest rates that encourage Australians to rent rather than buy, and relatively limited existing stock and new supply of all types of housing.
The United States, by contrast, has a more established student housing sector, but our view of the property type there is less favorable as compared to other regions. For a start, the demographics are less favorable given the population of 18-to-24 year-olds in the US is forecast to decline through 203321 and enrollment rates at 4-year institutions have remained roughly flat since 2010.22
An additional point of difference between US and European universities is their locations. Many top-tier US universities are in small cities in which a single school dominates the population and economy. Student housing properties in these markets are dependent on a single source of demand that controls enrollment growth and housing policy. Additionally, barriers to new supply are generally lower compared to major European cities, which allows for more new development to come in and disrupt the market. Taken together, these factors mean rent trends in these markets can be volatile. While there are similar university-centric towns in Europe, our investment focus is on the larger markets, where housing markets are tightest and there is a diverse demand base from multiple universities.
Looking ahead
Europe’s leading universities should continue to attract demand from students, both domestic and international, positioning student housing for further growth. However, this growth may be uneven given mixed demographic outlooks and the potential for government interference. Investors should focus on the most-supply constrained markets, where there are resilient and varied sources of demand from multiple universities.
European PBSA can act as a proxy for investment in the housing markets of supply constrained cities that face regulation, while generating cashflows more akin to investments in unregulated markets. We maintain our previously stated view that residential regulations can lead to lower cash flow volatility and thus may even mean better risk-adjusted returns. However, given the persistent housing shortages and continued demand for rental housing of all forms, we forecast rental growth across many European residential markets to be well ahead of inflation. This means in markets where residential landlords are constrained by inflationary indexation, owning PBSA may give investors a better opportunity to capture that market growth than does traditional residential.
Elsewhere in the world, the investment case for student accommodation is less compelling. The US market, for example, is characterized by a relatively weak demographic profile for student demand. Moreover, in many cases investing in it involves exposure to smaller cities to which investors would not otherwise seek exposure. That said, PBSA markets with similar characteristics to Europe, such as Australia, can offer interesting opportunities for global investors. For investors seeking higher returns, entry into sectors can be especially interesting when they are at the early stages of their emergence.
5 The number of European universities in the top 2000 spots Center for World University Rankings (CWUR) league tables per capita is the highest of any world region, according to data from CWUR, Oxford Economics, and analysis by LaSalle.
6 Source: Educationdata.org
7 Source: Eurostat
8 Source: HESA
9 Assuming no change in the propensity of people in that age cohort to attend university.
10 UK Government introduced policy on January 1st 2024
11 Source: European Central Bank
12 For deeper analysis of European housing markets and the underlying supply imbalance see LaSalle’s ISA Outlook 2024.
13 Source: JLL
14 LaSalle analysis of data taken from the national statistics agencies of major European countries (Germany, UK, France, Spain, Sweden, Denmark, Finland, Italy, Portugal, Netherlands, Ireland)
15 Source: MSCI Real Capital Analytics
16 Metric defined as number of purpose-built student beds as a share of total enrolled population of students in higher education.
17 Source: JLL
18 Source: UNESCO
19 Source: CBRE
20 Source: SQM Research (for private rental market), as of November 2023; CBRE (for PBSA), as of August 2023
21 Source: Oxford Economics
22 Source: National Center for Education Statistics (US)
Important Notice and Disclaimer
This publication does not constitute an offer to sell, or the solicitation of an offer to buy, any securities or any interests in any investment products advised by, or the advisory services of, LaSalle Investment Management (together with its global investment advisory affiliates, “LaSalle”). This publication has been prepared without regard to the specific investment objectives, financial situation or particular needs of recipients and under no circumstances is this publication on its own intended to be, or serve as, investment advice. The discussions set forth in this publication are intended for informational purposes only, do not constitute investment advice and are subject to correction, completion and amendment without notice. Further, nothing herein constitutes legal or tax advice. Prior to making any investment, an investor should consult with its own investment, accounting, legal and tax advisers to independently evaluate the risks, consequences and suitability of that investment.
LaSalle has taken reasonable care to ensure that the information contained in this publication is accurate and has been obtained from reliable sources. Any opinions, forecasts, projections or other statements that are made in this publication are forward-looking statements. Although LaSalle believes that the expectations reflected in such forward-looking statements are reasonable, they do involve a number of assumptions, risks and uncertainties. Accordingly, LaSalle does not make any express or implied representation or warranty, and no responsibility is accepted with respect to the adequacy, accuracy, completeness or reasonableness of the facts, opinions, estimates, forecasts, or other information set out in this publication or any further information, written or oral notice, or other document at any time supplied in connection with this publication. LaSalle does not undertake and is under no obligation to update or keep current the information or content contained in this publication for future events. LaSalle does not accept any liability in negligence or otherwise for any loss or damage suffered by any party resulting from reliance on this publication and nothing contained herein shall be relied upon as a promise or guarantee regarding any future events or performance.
By accepting receipt of this publication, the recipient agrees not to distribute, offer or sell this publication or copies of it and agrees not to make use of the publication other than for its own general information purposes.
This article first appeared in Winter 2024 edition of PREA Quarterly
LaSalle’s Global Head of Research and Strategy, Brian Klinksiek, discusses why it’s important to go beyond heuristics to find relative value in global real estate.
Which global real estate markets are ahead and which are behind in the process of repricing?
This question, along with its many variations, has been by some margin the most frequent one asked of me when presenting LaSalle’s recently released ISA Outlook 2024. Investors understandably want to know where they can find value amid real estate capital markets that continue to adjust to higher interest rates. They want to focus their efforts on geographies and sectors for which the bulk of the price adjustment is in the rearview mirror instead of still lying ahead.
Attempts to answer this question with numbers often begin with simple comparisons of peak-to-current value declines. The implicit logic is that larger-measured todate declines for a market indicate that it is farther along in the repricing process or, simply, that it is cheaper and thus attractive. But these sorts of analyses are plagued by a range of measurement and interpretation issues that complicate comparisons. At best, they can lead to contradictory conclusions; at worst, they may contribute to missteps in investment strategy. Some of the key challenges are explored below.
In the past decade, the urbanization narrative in the United States has shifted from the “rebirth of cities” to the “rise of the suburbs.”1 What are the drivers of this shift, and how does it impact real estate? In this ISA Briefing, we tackle these questions and share our outlook for how future dynamics could impact migration and urbanization trends.
Demographics is destiny
Demographic cohort effects are a key driver of the current shift. The generic, or median, location preferences of a cohort change as that cohort ages; as the relative growth of different age groups ebbs and flows it impacts the national trend towards urban and suburban location preference.
In the US, there are two outsized cohorts, the Baby Boomers and the Millennials, which as they age have a disproportionate impact on national averages (see chart below). In the early 2010s, the bulk of the Millennial cohort was in their 20s, and as young adults they had a preference for living in urban locations. In the present decade the same cohort is aging into their 30s and 40s, entering a life stage that tends to prefer living in suburban locations. Young families move to the suburbs to seek more space and because the local school funding system in the US tends to mean suburban schools are better funded. This shift began in the latter half of the 2010s as the older members of the cohort reached their mid-30s but was accelerated by the Covid-19 pandemic in 2020.
Sunbelt supremacy
Regional shifts also accelerated in the late 2010s as migration to the southern Sunbelt markets increased,2 driven in part by households moving in search of more affordable living and warmer weather compared to northern cities. While in-migration to high-cost metros slowed throughout the 2010s, and eventually turned negative, inflows to Sunbelt metros accelerated through 2016 before slowing because of lower international immigration. This also contributed to a national shift toward suburban living because Sunbelt metros such as Houston, Dallas, Atlanta and Phoenix lack the dominant central city with a strong central business district that is characteristic of older cities like New York, Boston, Chicago and Washington, DC.
As these Sunbelt metros grew faster, it led to a shift in the mix of apartments nationally towards suburban locations. This is shown in the NCREIF Property Index (NPI) data in the chart below. It shows that the NPI’s share of apartments in the south has increased since 2018; the same time when the share of suburban apartments started reversing the gains achieved in urban apartment share in the 2010s. (This analysis is done based on unit count, so is not driven by trends in relative values.)
Post-pandemic realities
The pandemic not only accelerated the urban and regional shifts already underway, but it set into motion a new set of forces that influence where households choose to live. The enduring popularity of remote work requires more space for a home office, which is cheaper in the suburbs, and commuting only a couple days per week makes living further from city centers more palatable. Owners of suburban apartments and shopping centers have benefitted as a result.
Conversely, having fewer downtown workers has hurt office values and urban retail, and the reduction in activity is a contributor to the increase in crime that has occurred in urban areas. Although violent crimes have come down after a pandemic-era spike, theft and property crimes increased in 2022 according to the FBI.3 Both types of crime remain significantly below the highs of the early 1990s, but public awareness seems elevated relative to the hard data. The crime issue extends into city neighborhoods as well, which can motivate some residents to move out of the city.
Evidence of an urban rebound
Despite the challenges, residents returned to urban areas as the pandemic receded. Chicago and San Francisco saw the number of occupied units in urban submarkets4 decline 4.0% and 7.4% from peak to trough during the early days of the pandemic.5 But they have since recovered; as of September 2023, Chicago had 6.6% more occupied units in urban submarkets compared to the prior peak and even hard-hit San Francisco had 1.9% more. The decline in urban renters was smaller in Sunbelt markets, with just a 1.2% and 1.4% decline in Dallas and Atlanta, respectively, and the rebound has been greater with 9.9% and 8.2% more occupied urban units compared to the previous peak.
At the same time, the relative affordability of the Sunbelt has declined. Home values have increased 47.8% in Dallas, 56.3% in Atlanta and 57.5% in Phoenix since 2019 as compared to 26.4% in New York, 36.0% in Boston and 21.3% in San Francisco.6 While major Sunbelt markets remain less expensive compared to Gateway cities, the narrowing of the relative affordability gap should, all else equal, reduce their draw.
Clarifying “urbanization” in DTU+E
As is typically the case, the “rise of the suburbs” narrative overstates the situation, but there are real dynamics behind the shift from urban growth to suburban growth that real estate investors need to pay attention to and build strategies around. At LaSalle, we have long sought to capture secular changes shaping real estate around the world through our Demographics, Technology, Urbanization and Environmental factors (DTU+E) framework. However, the term “urbanization” in this context is often misinterpreted as a one-direction shift towards urban places, when it is better understood as “urban and regional change,” which encompasses broader population shifts within and across metropolitan areas.
Indeed, it was with this lens that LaSalle Research and Strategy forecasted the suburban shift in the mid-2010s and redirected our apartment investment strategy from urban submarkets (what we labeled “Millennial Magnets” at the time) to suburban locations. In 2016, we recommended targeting apartments in the best school districts, which are mostly suburban. We continued to reinforce that focus as our internal target market recommendations shifted towards the suburbs and our risk assessments flagged the challenges facing urban markets. It is not sensible to assume “urbanization” is a one-way street, or that the direction of flow doesn’t change.
Globalizing the urban/suburban debate
To this point, our comments have applied to the US. Elsewhere in the globe, comparisons of suburban versus urban patterns can get tricky for a range of reasons. Even the terminology is challenging. In Australia, all neighborhoods other than CBDs are called “suburbs,” even if they are adjacent to the CBD. In Hong Kong, one might consider transit-centric high-rise New Towns to be “suburbs,” but they do not at all resemble American ones. At some point, the right question is simply: What locations are attracting people?
Looking at it this way requires a deeper dive into demographic, social and urban planning considerations that differ significantly from the US situation. For example, in Japan and Germany, declining rural populations is paired with migration into key cities. In Canada, very strong international in-migration combined with “greenbelts” that limit urban sprawl have led to an intensification of urban density. In the UK, which also has greenbelts, planning restrictions have had the unintended consequence of pushing demand for suburban living into rail-connected satellite cities that are discontinuous to the main built-up area of the metro. To dig into all these and other variations is beyond the scope of this ISA Briefing. However, applying the same lenses of demographic cohort effects, relative affordability and urban structure is a globally relevant approach.
LOOKING AHEAD
Suburban areas in the US continue to benefit from Millennials and then Generation Z seeking more space for their young families. That said, we do not expect an urban “doom loop,”7 but city taxes could increase more than other locations, limiting urban NOI growth.
We believe that “E factors”—or environment-related secular changes—are likely to represent generally positive demand drivers for cities. The lower carbon intensity of urban living could boost urban demand if carbon is taxed or otherwise regulated. Moreover, climate change could increase summer heat in southern markets while making northern winters milder. This could tip migration back toward the north.
High barriers to supply—or the inverse—can equally characterize both urban and suburban locations, depending on local circumstances. That said, the higher share of land value in total asset value in urban locations may imply greater potential for appreciation. Investors should remain on the lookout for urban locations with the best demand dynamics.
In-migration to Sunbelt markets has driven up housing prices, narrowing affordability gaps with older northern and coastal cities. This should allow other metro areas to emerge as destinations for affordability-driven migration; Columbus, Indianapolis and Louisville are example of cities that may be well positioned to benefit.
1 This is the US definition of a suburb. The concept of what is urban is both hard to define and varies in different markets around the world. In the US urban is generally understood as a dense area at the center of a metropolitan area. Suburbs are defined in contrast to that as being less dense areas that are still highly economically linked to the overall metropolitan area.
2 Commentary in this paragraph based on LaSalle analysis of Census Bureau data.
4 Urban submarkets as defined by RealPage as the most densely populated submarket(s) in a given market based on a metro’s Central Business District, the highest concentration of the market’s tallest multifamily assets, and/or higher rent per square foot than the market average. This includes the following RealPage submarkets: The Loop, Streeterville/River North, and Lincoln Park/Lakeview in Chicago; Downtown and SoMa in San Francisco; Buckhead, Downtown, Midtown, and Northeast in Atlanta; and Oak Lawn/Park Cities and Intown in Dallas.
5 Data from RealPage as of September 2023
6 Zillow, as of September 2023
7 “Doom loop” refers to a situation in which cities get stuck in a self-reinforcing loop of lower tax revenues requiring cuts to city services that reduce the quality of life which cause residents to leave and further reductions in tax revenues and the loop repeats ad infinitum.
Important Notice and Disclaimer
This publication does not constitute an offer to sell, or the solicitation of an offer to buy, any securities or any interests in any investment products advised by, or the advisory services of, LaSalle Investment Management (together with its global investment advisory affiliates, “LaSalle”). This publication has been prepared without regard to the specific investment objectives, financial situation or particular needs of recipients and under no circumstances is this publication on its own intended to be, or serve as, investment advice. The discussions set forth in this publication are intended for informational purposes only, do not constitute investment advice and are subject to correction, completion and amendment without notice. Further, nothing herein constitutes legal or tax advice. Prior to making any investment, an investor should consult with its own investment, accounting, legal and tax advisers to independently evaluate the risks, consequences and suitability of that investment.
LaSalle has taken reasonable care to ensure that the information contained in this publication is accurate and has been obtained from reliable sources. Any opinions, forecasts, projections or other statements that are made in this publication are forward-looking statements. Although LaSalle believes that the expectations reflected in such forward-looking statements are reasonable, they do involve a number of assumptions, risks and uncertainties. Accordingly, LaSalle does not make any express or implied representation or warranty, and no responsibility is accepted with respect to the adequacy, accuracy, completeness or reasonableness of the facts, opinions, estimates, forecasts, or other information set out in this publication or any further information, written or oral notice, or other document at any time supplied in connection with this publication. LaSalle does not undertake and is under no obligation to update or keep current the information or content contained in this publication for future events. LaSalle does not accept any liability in negligence or otherwise for any loss or damage suffered by any party resulting from reliance on this publication and nothing contained herein shall be relied upon as a promise or guarantee regarding any future events or performance.
By accepting receipt of this publication, the recipient agrees not to distribute, offer or sell this publication or copies of it and agrees not to make use of the publication other than for its own general information purposes.
Chase McWhorter, Institutional Real Estate, Inc.’s managing director, Americas, recently spoke with Richard Kleinman, Americas Head of Research and Strategy and co-CIO at LaSalle, to discuss what institutional real estate investors can expect in the new year.
They covered a wide range of topics in their conversation, including the biggest unknowns for 2024, sector outlooks, credit, capital fundraising and key differences between the real estate markets in the US and Canada.
Brian Klinksiek recaps his keynote address at the Global Property Market Conference
On November 28, LaSalle’s Global Head of Research and Strategy, Brian Klinksiek, gave a keynote address at Canadian Real Estate Forum’s annual Global Property Market conference in Toronto where he discussed our global real estate investment themes for 2024:
The ongoing search for peak rates
Solving the capital stack equation
Favored sectors coming off the boil
Moving beyond bifurcation in the market
The changing definitions of quality and core
These themes are discussed in detail in ISA Outlook2024, our annual publication designed to help our clients and partners navigate the year ahead. It brings together smart perspectives and investment ideas from our teams around the world, based on what we see across our more than 1,500 assets that span geographies, property types and risk profiles.
CHICAGO (Dec. 5, 2023) – The US and Canadian real estate markets continue to see subdued transaction volume and a wait-and-see approach from investors amid their respective central banks’ campaigns to snuff out inflation through interest rate hikes. LaSalle’s Insights, Strategy and Analysis (ISA) Outlook 2024 makes the case that secular trends, not cyclical trends, may hold answers as to where winning property types will land in 2024, with the early half of the year looking similar to 2023 and the potential for a rebound later in the year.
The report will be released in regional chapters throughout November and December, and can be viewed at: www.lasalle.com/Outlook2024.
The ISA Outlook 2024 looks at five key themes from a global and regional level:
The search for peak interest rates
Solving the capital stack equation
Coming off the boil
Beyond bifurcation
The changing definition of quality and core
On a broad basis in the Americas, the report observes a potential recovery later in 2024, a continued focus on interest rates and their impact and the potential for supply weighing on real estate fundamentals.
Brian Klinksiek, Global Head of Research and Strategy at LaSalle, said: “Significant unknowns remain in the global real estate market as we head into 2024, including interest rates, geopolitical tensions, and whether major economies may tip into recession. While it’s very difficult to time markets, data on previous down cycles suggest that it’s often during unsettled periods that savvy investors can find strong value in real estate, making this a potentially strong vintage for investment.”
Select ISA Outlook 2024 findings for North America include:
The residential (encompassing both single-family rental and apartments) sector continues to see healthy fundamentals. However, as the report notes, residential properties that were bought at peak pricing in 2021 and 2022 and financed with elevated levels of floating rate debt will need to either be recapitalized or sold which may cause a cooling effect on the sector in 2024. The industrial sector will also cool from peak performance levels, with pockets of softening rents in some markets. Both residential and industrial will benefit in time from the reduced levels of new development starts in 2023 and beyond.
Select sub-sectors of retail such as US grocery-anchored properties are seeing a boost in investor confidence. Limited new supply and a better understanding of which assets are better positioned is creating confidence that these properties can be an accretive portion of a balanced real estate portfolio.
The question around the future of office properties continues to be pervasive, and something investors are watching closely. The report observes a divide between Canadian and US office markets with Canada slightly better positioned than the US due to lease structures. The US continues to deal with substantial work-from-home headwinds. The report notes that widespread distress may lead to high-risk, high-reward opportunities for investors.
Rich Kleinman, Co-CIO and Head of Research & Strategy for the Americas at LaSalle, said, “Looking at real estate investment solely through the lens of interest rates means you’re missing the bigger picture as we believe sectors and markets will adjust to rates at varying speeds. Investors with dry powder, flexibility and who can identify price gaps are likely to come out as winners in this transitional market.”
Chris Langstaff, Head of Research & Strategy for Canada at LaSalle, said, “Looking to 2024, we expect that in the midst of a continued softening of the Canadian economy in the near term, the strong migration trends will support long-term growth of the Canadian economy. This will particularly benefit the apartment and industrial sectors when economic growth resumes.”
About LaSalle Investment Management | Investing Today. For Tomorrow.
LaSalle Investment Management is one of the world’s leading real estate investment managers. On a global basis, LaSalle manages approximately $89 billion of assets in private and public real estate property and debt investments as of Q3 2023. LaSalle’s diverse client base includes public and private pension funds, insurance companies, governments, corporations, endowments and private individuals from across the globe. The firm sponsors a complete range of investment vehicles including separate accounts, open- and closed-end funds, public securities and entity-level investments. For more information, please visit www.lasalle.com, and LinkedIn.
Forward looking statement
The information discussed above is based on the market analysis and expectations of LaSalle and should not be relied upon by the reader as research or investment advice regarding LaSalle funds or any issuer or security in particular. The information presented herein is for illustrative and educational purposes and is not a recommendation, offer or solicitation to buy or sell any securities or to adopt any investment strategy in any jurisdiction where prohibited by law or where contrary to local law or regulation. Any such offer to invest, if made, will only be made to certain qualified investors by means of a private placement memorandum or applicable offering document and in accordance with applicable laws and regulations. Past performance is not indicative of future results, nor should any statements herein be construed as a prediction or guarantee of future results.
Company news
Jun 18, 2025 LaSalle acquires Ruby Stella Hotel in Clerkenwell
The five-building industrial complex was acquired on behalf of the LaSalle Property Fund.
Feb 11, 2025 Kunihiko Okumura and Steve Hyung Kim appointed Asia Pacific leaders
Keith Fujii to assume the role of Chairman of Asia Pacific, with all changes to be effective July 1, 2025.
Make sure you’ve spelled everything correctly, or try searching for something else. If you still can’t find what you’re looking for, you can always Contact us to talk to someone.
LONDON (29 November 2023) – Despite a challenging macroeconomic picture, European real estate has begun to acclimatise to higher interest rates and will offer some of the world’s most attractive supply-demand dynamics next year, according to the Insights, Strategy and Analysis (ISA) Outlook 2024 report published by global real estate investment manager LaSalle Investment Management (“LaSalle”).
Last year’s report predicted European macro headwinds and a stall in capital markets activity, but also strong real estate market fundamentals. Looking ahead, the 2024 ISA Outlook for Europe describes how investors that are ready to move out of waiting mode, with realistic expectations for operating income growth, can find compelling new investment opportunities.
This year’s report identifies five trends that differentiate Europe and earn the region’s real estate assets an important place in investors’ property portfolios:
Europe’s city centre vibrancy and occupier demand have strongly rebounded
The region’s firms and individuals are taking the lead in decarbonization
Skilled migration is supporting growth
Expansion of the EU’s single market is regaining traction
The high prevalence of inflation-index commercial leases in the EU has helped the region’s property cash flows to better keep pace with inflation
These trends are driving demand in particular for logistics and rental housing, as well as superior performance by offices in the ‘super-prime’ segment.
Macro challenges but appealing supply-demand dynamics
Having defied expectations of a recession in 2023, Europe still faces elevated recession risk. Inflation has begun to abate but proven comparatively stubborn, particularly in the UK, inducing higher policy rates from the ECB and Bank of England. As the delayed impact of rising rates begins to bite, European property markets enter 2024 searching for a clear peak in interest rates – as well as an end to the war in Ukraine.
Europe’s occupational fundamentals are coming off the boil of recent years, with rental growth set to cool to its lowest level since 2020 next year. However, we expect that average rent growth should remain positive, especially for logistics and rental housing – even in an economic downturn – helped by low vacancy rates relative to history.
In logistics, while demand has cooled across Europe and vacancy is ticking up from extremely low levels, a shrinking construction pipeline means that the long-term revenue growth outlook remains very bright. The scope for further e-commerce market penetration is, conversely, a headwind for European retail. However, assets such as outlet centers with turnover-linked leases have lifted revenues in line with nominal sales growth.
Investors in Europe can access strategies rooted in barriers to supply, arising from Europe’s high (and rising) constraints on development. Nowhere does this apply more than in the residential sector, where the undersupply is chronic, while migration powers long-term demand growth. Surging student demand and rising mortgage rates are causing people to rent for longer and until later in life, boosting demand further in Purpose-Built Student Accommodation and rental housing specifically.
Opportunities on the leading edge of offices
European city centers are returning to their pre-Covid levels of vibrancy, attracting office occupiers and capital to more central locations. To better understand how this spectrum of office quality is evolving, we recommend going beyond ‘bifurcation’ alone in segmenting the market. The widening gaps between leading and lagging offices are determined by a range of many factors like location, design, amenities and sustainability.
In London, “super-prime” office buildings command significant rent premiums to “prime” averages. Since 2019, the UK capital’s median office relocation was from a non-BREEAM-rated EPC-D building to BREEAM Excellent / EPC-B or better. Across Paris and London, new offices’ vacancy rate is c.2%, three times less than for second-hand offices. Notably, centrally located, modern offices in Paris and Munich have defied subdued transaction levels and remain liquid, with sales attracting respectable bidder pools.
Alternative lenders gain momentum
Outside of these pockets of investment activity, alternative lenders are well positioned to solve capital stack equations in 2024, filling gaps created by banks’ reduction in LTVs to provide debt financing that generates attractive risk-adjusted returns.
Dan Mahoney, Head of European Research and Strategy at LaSalle, said: “What we are seeing in Europe is real estate markets beginning to acclimatise to the higher-rate environment and gradually shift out of the waiting mode that has chilled transaction volumes in 2023. The continent’s distinct combination of rebounding city vibrancy, high supply barriers and compelling conditions for debt make it an important allocation in global real estate portfolios.”
Brian Klinksiek, Global Head of Research and Strategy at LaSalle, added: “Significant unknowns remain in the global real estate market as we head into 2024, including interest rates, geopolitical tensions, and whether major economies may tip into recession. While it’s very difficult to time markets, data on previous down cycles suggest that it’s often during unsettled periods that savvy investors can find strong value in real estate, making this a potentially strong vintage for investment.”
Ends
About LaSalle Investment Management | Investing Today. For Tomorrow.
LaSalle Investment Management is one of the world’s leading real estate investment managers. On a global basis, LaSalle manages approximately $78 billion of assets in private and public real estate property and debt investments as of Q1 2023. LaSalle’s diverse client base includes public and private pension funds, insurance companies, governments, corporations, endowments and private individuals from across the globe. LaSalle sponsors a complete range of investment vehicles, including separate accounts, open- and closed-end funds, public securities and entity-level investments. For more information, please visit www.lasalle.com, and LinkedIn.
NOTE: This information discussed above is based on the market analysis and expectations of LaSalle and should not be relied upon by the reader as research or investment advice regarding LaSalle funds or any issuer or security in particular. The information presented herein is for illustrative and educational purposes and is not a recommendation, offer or solicitation to buy or sell any securities or to adopt any investment strategy in any jurisdiction where prohibited by law or where contrary to local law or regulation. Any such offer to invest, if made, will only be made to certain qualified investors by means of a private placement memorandum or applicable offering document and in accordance with applicable laws and regulations. Past performance is not indicative of future results, nor should any statements herein be construed as a prediction or guarantee of future results.
Company news
Jun 18, 2025 LaSalle acquires Ruby Stella Hotel in Clerkenwell
The five-building industrial complex was acquired on behalf of the LaSalle Property Fund.
Feb 11, 2025 Kunihiko Okumura and Steve Hyung Kim appointed Asia Pacific leaders
Keith Fujii to assume the role of Chairman of Asia Pacific, with all changes to be effective July 1, 2025.
Make sure you’ve spelled everything correctly, or try searching for something else. If you still can’t find what you’re looking for, you can always Contact us to talk to someone.
With shifting interest rates, dynamic occupier fundamentals and deepening bifurcation within sectors, ISA Outlook 2024 asks how real estate investors should respond to rapidly changing market conditions. To answer these questions and more, we published four separate chapters covering the global and regional outlooks over the course of November and December.
Download the full document now, or individual chapters covering the Global, European, North American and Asia Pacific outlooks are available in the tabs below.
The global macroeconomic context for real estate remains unsettled, and more so than earlier in 2023. Until late summer, interest rates in most major markets exhibited high volatility, but little overall trend. They moved mainly sideways, owing to cooling inflation and expectations that central banks were reaching the end of their tightening cycles. This was helpful in setting a pricing baseline for real estate investors. But the outlook for rates and thus real estate pricing has become more unsettled of late.
What does this mean for real estate and how does it intersect with other key trends?
Make sure you’ve spelled everything correctly, or try searching for something else. If you still can’t find what you’re looking for, you can always Contact us to talk to someone.
European property markets have been waiting for a peak in European Central Bank and Bank of England policy rates, for an end to the war in Ukraine and for bid-ask pricing spreads to resolve. Investors ready to move out of waiting mode in 2024 can benefit from rebased prices, opportunities to solve capital stack equations, and strong fundamentals in many sectors.
In this chapter of ISA Outlook 2024, we examine the state of the European market and conclude with recommendations for specific investment strategies – underpinned by realism and targeted toward areas of forecast resilient income growth.
Make sure you’ve spelled everything correctly, or try searching for something else. If you still can’t find what you’re looking for, you can always Contact us to talk to someone.
Against a volatile macroeconomic backdrop and with growth expected to slow, we believe that in 2024 it will be the trajectory of interest rates that will have the greatest impact on real estate values in the US and Canada.
As investors continue to adapt to cooler conditions, this chapter of ISA Outlook 2024 examines the current landscape and looks ahead to the coming year, including where we see select opportunities emerging, as well as variation between the two markets. We conclude with three broad strategic themes and recommended strategies where investors may consider deploying their capital.
Make sure you’ve spelled everything correctly, or try searching for something else. If you still can’t find what you’re looking for, you can always Contact us to talk to someone.
The sheer size and complexity of the Asia Pacific region means real estate markets and investment opportunities are as diverse as the region itself.
In the final chapter of ISA Outlook 2024, we discuss this complexity and how China’s new economies – such as high-tech manufacturing and biotechnology – are growing rapidly and, after more than two decades, Japan is hoping to bid sayōnara to deflation. In other key parts of the region – Australia, Hong Kong, Singapore and South Korea – central banks are near the end of their rate-hiking campaigns in a bid to lower inflation which, as in the rest of the world, could lead to a rebound in transaction activity.
Make sure you’ve spelled everything correctly, or try searching for something else. If you still can’t find what you’re looking for, you can always Contact us to talk to someone.
Published every year since 1993, LaSalle’s annual ISA Outlook is designed to help our clients and partners navigate the year ahead. It brings together smart perspectives and investment ideas from our teams around the world, based on what we see across our more than 1,500 assets that span geographies, property types and risk profiles.
As always, we welcome your feedback. If you have any questions, comments or would like to learn more, please get in touch by using our Contact Us page.
(L-R) LaSalle’s Brian Klinksiek, Matthew Wapelhorst and Frederik Burmester
In an uncertain market, it is tempting to prioritize cyclical questions such as the risk of recession and the path of interest rates over structural topics with longer-run implications. But challenging periods in real estate markets can also be attractive times to build exposure to the asset class.1 Questions about how to build portfolios do not diminish in importance just because bond market volatility makes front-page news. In our view, one of the most useful starting points for approaching portfolio construction is having a sense of the size of the real estate investable universe and its subcomponents. This is why we regularly update our estimates of the real estate investable universe and have done so consistently since 2005.
We first shared our latest estimates for the size of the global real estate universe in the 2023 edition of ISA Portfolio View. As described there, the vast scale of real estate as an asset class is among the key pillars supporting the case for including property in multi-asset portfolio. But putting a thoughtful number on the size of the asset class is easier said than done. We believe it is worth the effort because quantifying the size and distribution of the market — rather than just a subset covered by a particular index or data source — helps investors sharpen their thinking on target allocations by asset class, geography and investment structure. A full description of our methodology, data sources and summary table by country is available here, and we are glad to provide additional detail upon request.
We estimate market size, defined as aggregate gross asset value, for three nested segments, shown below. The largest and most comprehensive estimate is for all property held for the income it provides, inclusive of all types of owners (except owner-occupiers) and all quality levels. Using a separate methodology, we also estimate real estate owned by institutional investors, and by one particular type of institutional investor — those whose equity is publicly traded.
Our analysis shows that one fifth of global real estate is owned by institutional investors, and 40% of that institutional ownership is by listed companies. The estimates also break down market size by country, property type and city, using a methodology combining several bottom-up and top-down sources.
We take a closer look in this ISA Briefing at three key findings from the real estate universe analysis: (1) global income-producing real estate has recently ebbed to a below-average size relative to GDP, (2) real estate value has a fairly even distribution across the three major global regions and (3) those regions differ significantly in how real estate is distributed across metros, implying different optimal diversification strategies.
1: Real estate is large, but at a cyclical ebb
Figures in trillions can be so enormous that they lose some meaning — so it is helpful to put those numbers in context. An illuminating comparison is to put income producing real estate alongside other asset classes like stocks and bonds, as shown in the graph below.
These estimates show global real estate is a smaller sibling to stocks and bonds but very much in the same family of major asset classes. Notably, owner-occupied residential real estate, which is not included in LaSalle’s real estate estimates, is significantly larger in size than all income-producing property, and even larger than the global fixed-income market.
Another useful comparator, shown below, is against global GDP. We estimate that real estate is equal to 60% of global GDP in 2023. This puts it at a low ebb relative to recent history. This is consistent with the historic pattern of real estate comprising a higher share of GDP late in expansions and then a lower share of GDP in repricing episodes. Currently our real estate market size estimate is near previous cyclical lows as a share of GDP seen in 2009-2012. Since 2000, our real estate market size estimates have averaged 68% of global GDP.
2: Still a global asset class
A second key finding from LaSalle’s universe estimates is the relatively even split in value observed between the three major regions of the Americas, Asia Pacific, and Europe. We estimate that 35% of income producing property is in the Americas, 31% in Asia Pacific, and 29% is in Europe. We believe these estimates from LaSalle’s real estate universe analysis better reflect the true opportunity set than other splits based on simple GDP or real estate indices, which can sometimes be lopsided based on where coverage is greatest or which types of investment fund products predominate. For example, 67% of the MSCI Global Property Fund Annual Index AUM is in North America.2
The split above suggests an even distribution of opportunities by region. At the same time, our national estimates also show global diversification can be achieved with a small number of countries. The eight countries with the most institutional-invested real estate together account for 70% of the invested universe. A focus on these larger countries — as well as multi-country funds — can enable investors to efficiently achieve diverse exposures, while also managing the challenges that come with differences in market practices, currency, regulation and building market knowledge.
3: Big regional differences in universe at city level
Our third notable finding emerges when zooming in one level further from the national level to individual cities. Cities and their surrounding metropolitan areas form the underlying building blocks of the real estate universe; they are often the basic level of analysis investors have in mind when comparing market allocations.
LaSalle estimates institutional real estate market size are for the entire metropolitan (metro) market — including the principal city and its suburbs that are economically connected to it, adopting official metropolitan area definitions from national statistical agencies where available.
Real estate held in institutional investor portfolios is highly concentrated in the largest metros, and these local market size estimates highlight the degree of that concentration. The 40 largest metropolitan real estate markets account for 58% of all institutional property. Some of the world’s largest metro areas dwarf many individual countries when it comes to institutional real estate ownership. Our latest estimates show that there is likely more institutional-owned real estate in Greater Tokyo than in all but three of the 201 countries covered in our estimates.
The metro market size distribution varies considerably across regions, with important implications for portfolio strategy. Institutional real estate ownership in Asia Pacific is more concentrated in its largest metros than in any other region. And its real estate is far more concentrated in a few cities than its population. In Asia Pacific, 18 metros account for 75% of institutional property, whereas the equivalent metro total is 52 in the Americas. In Europe, real estate is the most dispersed across cities, reflecting its more fragmented quilt of different jurisdictions. Over 100 European metros must be amalgamated to account for 75% of the regional total. Such dispersion makes the task of setting target markets even more complex, which is where tools like the recently released LaSalle European Cities Growth Index (ECGI) can help.
These differences impact investment strategy and approaches to diversification. Asia Pacific’s concentration of large institutional markets implies that investors may be able to achieve diversification by investing in fewer metros, but that it is also a region where each “bet” on geo-market allocation matters more. In Europe and North America, investors are more active across a larger number of medium-sized markets, offering diversification benefits as well as challenges in terms of access and efficiency.
Looking ahead
The real estate universe is massive — it constitutes a meaningful portion of all global investable assets across asset classes — and therefore is a key piece of diversified mixed asset portfolios. Its ratio to global GDP is now below its long-term average, near past cyclical lows seen on this measure. Over a ten-year horizon, we expect real estate to grow as a share of GDP.
The real estate universe is evenly dispersed by region (though concentrated by country and city). A globally balanced portfolio would give roughly a one-third weighting each to North America, Asia Pacific and Europe.
The concentration of institutional real estate in highly transparent countries and in major metro areas implies that investors can achieve a good degree of diversification with a small number of countries and moderate number of metro markets, with differences across region.
Investable universe estimates can help investors devise ‘neutral weights’ for markets and sectors, which they can then adjust based on structural considerations (e.g. tax status) and their views of relative value. We look forward to sharing our outlook and strategic recommendations for 2024 real estate investment in our upcoming ISA Outlook 2024, the first installment of which will be released on November 14.
Footnotes
1 Vintages around the time of market disruption tend to outperform, according to LaSalle analysis of data from the INREV Global IRR Index through Q4 2022. See page 30 of our ISA Portfolio View for a more complete discussion of this analysis.
2 Source: MSCI. Data as of 2022 (most recent available).
Important Notice and Disclaimer
This publication does not constitute an offer to sell, or the solicitation of an offer to buy, any securities or any interests in any investment products advised by, or the advisory services of, LaSalle Investment Management (together with its global investment advisory affiliates, “LaSalle”). This publication has been prepared without regard to the specific investment objectives, financial situation or particular needs of recipients and under no circumstances is this publication on its own intended to be, or serve as, investment advice. The discussions set forth in this publication are intended for informational purposes only, do not constitute investment advice and are subject to correction, completion and amendment without notice. Further, nothing herein constitutes legal or tax advice. Prior to making any investment, an investor should consult with its own investment, accounting, legal and tax advisers to independently evaluate the risks, consequences and suitability of that investment.
LaSalle has taken reasonable care to ensure that the information contained in this publication is accurate and has been obtained from reliable sources. Any opinions, forecasts, projections or other statements that are made in this publication are forward-looking statements. Although LaSalle believes that the expectations reflected in such forward-looking statements are reasonable, they do involve a number of assumptions, risks and uncertainties. Accordingly, LaSalle does not make any express or implied representation or warranty, and no responsibility is accepted with respect to the adequacy, accuracy, completeness or reasonableness of the facts, opinions, estimates, forecasts, or other information set out in this publication or any further information, written or oral notice, or other document at any time supplied in connection with this publication. LaSalle does not undertake and is under no obligation to update or keep current the information or content contained in this publication for future events. LaSalle does not accept any liability in negligence or otherwise for any loss or damage suffered by any party resulting from reliance on this publication and nothing contained herein shall be relied upon as a promise or guarantee regarding any future events or performance.
By accepting receipt of this publication, the recipient agrees not to distribute, offer or sell this publication or copies of it and agrees not to make use of the publication other than for its own general information purposes.
We have been fielding questions on two big macroeconomic topics impacting the Asia-Pacific region: (1) the outlook for China’s economic recovery and (2) the path of the Bank of Japan’s monetary policy. These involve legitimate worries about China’s growth engine and the risk of interest rate hikes in Japan. Nonetheless, we find that media coverage of these topics can sometimes sensationalize their implications without going below the surface.
In this ISA Briefing, and the accompanying LaSalle Macro Quarterly (LMQ), we dissect these concerns and share our views on several frequently asked questions. Our analysis points to a nuanced picture that is more supportive of investments in these two countries than the media coverage might suggest.
China’s economic recovery
China’s economic recovery has been slower than in past cycles, as we anticipated in our ISA Briefing from early March (China’s Great Reopening). While exports and for-sale residential investment have been sluggish, domestic consumption, industrial output, manufacturing and infrastructure investment continue to support the economy (see the chart below). The for-sale residential market could bottom in the next 6-12 months as demand-supply dynamics gradually improve. Unlike previous downturns, the government has not announced a blast of mega monetary or fiscal stimulus. This conservative approach could help ensure a sustainable long-term growth environment for the Chinese economy without unintentionally creating new imbalances.
We expect economic activity in China to continue to recover through 2024. Various supportive economic measures designed to boost business and consumer confidence were rolled out after the Politburo meeting on July 24; however, it takes time for stimulus measures to take effect. We continue to expect a modest recovery in China this year, likely close to the 5% GDP growth target. But oft-cited concerns over the Chinese economy such as the weak for-sale residential sector, the defaults of highly leveraged real estate developers, high youth unemployment and deflationary pressures deserve to be addressed, as we do in this FAQ.
GDP growth and key economic indicators in China in Q2 2023
Note: The growth rate of industrial value-added is the y-o-y growth rate of the YTD data. The growth rates of other indicators are the y-o-y growth rates of quarterly data. The historical ranges of the indicators are based on historical y-o-y growth rates in the 20 quarters in 2015-2019.
Sources: The National Bureau of Statistics of China (GDP growth, retail sales volume, fixed asset investment growth, and industrial value-add growth), as of Q2 2023; General Administration of Customs (export growth), as of Q2 2023; LaSalle Investment Management (retail sales growth), as of Q2 2023.
Q: How concerning is the outlook for China’s housing market?
A: The for-sale residential sector is stabilizing in the largest cities.
Despite short-term volatility in sales volume and prices, China’s for-sale residential sector is experiencing a slowing decline in sales volumes and prices compared to the second half of 2022. In Tier 1 cities, however, both sales volume and prices are already improving [LMQ page 24]. In the next 6-12 months, the overall for-sale residential market could reach bottom, supported by government policies, a decline in supply and a reduction in mortgage rates and down payments. We expect the subsequent recovery to be gradual. For-sale residential prices may improve, though sales volumes are unlikely to recover to their prior peak. We expect housing markets in Tier 1 and top Tier 2 cities to lead the recovery of low-tier cities.
Q: What about the troubled developers?
A: Highly leveraged developers are likely to have only a marginal impact on the Chinese financial system.
Despite our expectation of an eventual recovery in China’s for-sale residential sector, the outlook for over-leveraged developers with large exposures to low-tier cities, including Evergrande and Country Garden, remains gloomy. The resolution of these developers’ onshore and offshore corporate debt is expected to take time, which will continue to draw media attention. However, the impact of the default or bankruptcy of these troubled residential developers on the Chinese financial system has been limited so far, and we expect it to remain so, given the exposure of Chinese commercial banks to real estate construction loans only accounted for ~4% of their total assets as of the second quarter of 2023.1 Even for the more vulnerable trust companies, the exposure to real estate declined from ~13% of their total assets in the second quarter of 2019 to ~5% in the second quarter of 2023.2
Q: What is the story with rising youth unemployment?
A: The high youth unemployment rate is misleading.
The unemployment rate of the labor force aged 16-24 in China is rising. However, the direct impacts of this on retail sales and the broader economy are likely to be limited. Those aged 16-24 accounted for only around ten percent of the Chinese population as of 2021.3 In addition, many of those aged 16-24 are still in school, given that young people in China finish education at around age 20, on average.4 There could be some indirect impacts of high youth unemployment on household confidence, although we do not expect them to be significant given that the unemployment rate for the key labor force in China (aged 25-59) is at its lowest level since 2018 [LMQ page 25].
Q: Is China at risk of deflation?
A: It is premature to make the call that China is entering a deflationary period.
It is true that China’s headline inflation rates have been fluctuating around 0% in recent months, primarily driven by food and energy prices coming off peak levels post lockdowns. However, the core inflation rate (excluding food and energy) remains in positive territory [LMQ page 16]. As the Chinese economy gradually recovers and the post-lockdown effects fade, we expect inflation to gradually escalate.
Looking ahead
Western commentators have generally been disappointed at China’s lack of bazooka stimulus to reinvigorate the economy. The Chinese government’s approach has been to instead focus on smaller stimulus measures or targeted policy shifts. We believe that even if all these supportive actions fail, China still has many options it can implement to boost the economy. In our view, there is a high probability that the Chinese economy could reach its 5% GDP growth target by the end of the year.
China’s mild economic recovery and slowly improving business and household confidence suggest the demand recovery for income-producing real estate in China could be modest in the near term. Net absorption of major sectors including office, logistics, retail and rented multifamily in the next 12-18 months is likely to be below the levels seen in 2021.
Troubled for-sale residential developers may continue to offload assets to repair their balance sheets. Over the past decade, Chinese developers have built large portfolios of commercial real estate, mainly composed of offices, retail malls, and hotels. A small number of these developers also own assets in our favored sectors, such as multifamily rental and logistics. Distressed sales at attractive prices could continue to surface in the next 6-12 months.
The path of Japanese monetary policy
The Bank of Japan (BoJ) remains an outlier among global central banks, as it continues to maintain ultra-accommodative policy in the form of yield curve control (YCC). The BoJ introduced YCC in 2016, with the intent to keep 10-year government bond yields low to stimulate consumer spending and business investment. Over the past year, speculation has mounted as to whether this policy would be sustained, with volatility being triggered around moments of policy adjustments or speculation that YCC would be abandoned.
Most recently, on September 22, the BoJ kept the YCC policy unchanged with a unanimous vote. The 3-month rates used a reference for borrowing costs have been bouncing around -0.2 to -0.1%, while the 10-year Japanese government bond (JGB) yields have increased to 0.73% since the BoJ’s surprise tweak to the YCC in December last year [LMQ page 7].5 Inflation in Japan has been running above the BoJ’s two percent target over the past 17 months,6 which in theory could be a catalyst for the BoJ to make more tweaks to its YCC policy or even exit it in the near term. But the answers to complex questions about the trajectory of rates in Japan aren’t so simple; policy actions and capital market reactions are inherently difficult to predict, but are likely to be less dramatic than feared.
Q: Isn’t the BoJ under pressure to change policy to tackle above-target inflation?
A: The two percent inflation target is likely to be achieved in the short term, but the BoJ is focusing on whether the target can be achieved sustainably.
The latest BoJ inflation projections and Tankan survey results7 suggest that inflation could remain above the BoJ’s 2% target at least over the next 12 months [LMQ page 19]. Wages in Japan, a key component of inflation, grew by 2.3% y-o-y in July 2023 due to a tight labor market.8 Employment conditions are expected to tighten further in the near term,9 potentially reaching levels last seen in 1990s. The 2024 Shunto (spring) wage negotiation is the next key event to monitor. Hence, it is as yet uncertain whether wage growth in Japan could remain consistently above its 2% target.
Inflation and core inflation in Japan
Source: The Japan Statistics Bureau (historical inflation data), as of August 2023. The Bank of Japan (inflation projection for fiscal year 2023 and 2024), as of July 2023.
Inflationary pressures do not exist in a national vacuum. Thankfully, inflation is now declining in other developed markets [LMQ page 12], potentially giving the BoJ more time to evaluate the prospects for inflation in Japan. Many central banks, following the lead of the US Federal Reserve, are seen to be at or near the end of their tightening cycles as inflationary pressure tapers. That said, global central banks are highly unlikely to cut interest rates sharply any time soon, unless economies fall into deep recession. Therefore, we expect the interest rate differential between Japan and the US to remain wide but may narrow somewhat in the near term. Moderation in the interest rate differential could help the weak yen to regain some ground, which might also alleviate some pressure on the BoJ.
Q: How do you read the political tea leaves around BoJ’s policy?
A: Policymakers will tread carefully as they do not want to upset the labor market and the financial system.
Inflation in Japan has been outpacing wage growth, putting pressure on Prime Minister Fumio Kishida’s approval ratings, according to a poll conducted by the Asahi Shimbun newspaper on September 18. There is a strong political impetus for Kishida and the new cabinet to ensure wage growth consistently exceeds the inflation rate. Moreover, as more than 70% of the mortgage loans in Japan have floating rates,10 there is a strong incentive for the BoJ to keep short-term interest rates relatively low. BoJ measures that could derail Japan’s economic recovery or disrupt the capital markets could be considered politically risky and thus less likely.
Looking ahead
Forward markets indicate that 3-month interest rates are expected to enter positive territory but remain below 0.2% over the next two years, which implies that borrowing costs in Japan would remain much lower than those of other developed economies. Leveraged real estate yields in Japan remain higher than unlevered yields, in contrast to many other markets where real estate debt is now priced at levels that lead to “negative leverage” at today’s pricing. Japanese real estate debt costs could remain relatively low if the forward markets’ prediction is accurate.
Yields on 10-year JGBs have increased sharply by Japan’s historical standards since the BoJ loosened the YCC in December 2022. The forward markets imply that 10-year JGB yields could increase to close to 1.1% by September 2025, near the level last seen in the second half of 2011. Such an increase would be modest by global comparison but could be viewed as a step closer to interest rate normalization. Given “the math” of rate rises when the starting point is low in absolute terms, even a modest increase in 10-year JGB yields could have some impact on Japanese real estate valuations, a risk that investors should anticipate and plan for accordingly.
Nonetheless, there are still wide gaps between JGB yields, current yields on other asset classes and real estate yields. This makes income-producing Japanese real estate investments attractive, especially for domestic investors, who dominate the market. With a uniquely wide positive spread between borrowing costs and cap rates, we expect Japan to continue to remain the most liquid institutional real estate market in Asia-Pacific for the foreseeable future, albeit with some volatility at times.
Footnotes
1 Source: The People’s Bank of China (total amount of outstanding real estate construction loans), as of Q2 2023; State Administration of Financial Supervision and Administration of China (total assets of commercial banks), as of Q2 2023 2 Source: The China Trustee Association, as of Q2 2023 3 Source: The National Bureau of Statistics of China, as of 2021 4 Source: LaSalle Investment Management, as of 2021. The estimation is based on the average years of education among the young labor force in China published by the Ministry of Education of China in 2021. 5 Source: Bloomberg, as of September 25, 2023 6 Source: The Japan Statistics Bureau, as of August 2023 7 Source: The Bank of Japan’s Tankan survey on the inflation expectation and the output price expectation among corporates of all industries, as of June 2023 8 Source: The Japan Statistics Bureau, as of August 2023 9 The Bank of Japan’s Tankan survey: all-industry employment conditions, as of June 2023 10 Source: The Japan Housing Finance Agency, covering home loans between October 2022 and March 2023.
Important Notice and Disclaimer
This publication does not constitute an offer to sell, or the solicitation of an offer to buy, any securities or any interests in any investment products advised by, or the advisory services of, LaSalle Investment Management (together with its global investment advisory affiliates, “LaSalle”). This publication has been prepared without regard to the specific investment objectives, financial situation or particular needs of recipients and under no circumstances is this publication on its own intended to be, or serve as, investment advice. The discussions set forth in this publication are intended for informational purposes only, do not constitute investment advice and are subject to correction, completion and amendment without notice. Further, nothing herein constitutes legal or tax advice. Prior to making any investment, an investor should consult with its own investment, accounting, legal and tax advisers to independently evaluate the risks, consequences and suitability of that investment.
LaSalle has taken reasonable care to ensure that the information contained in this publication is accurate and has been obtained from reliable sources. Any opinions, forecasts, projections or other statements that are made in this publication are forward-looking statements. Although LaSalle believes that the expectations reflected in such forward-looking statements are reasonable, they do involve a number of assumptions, risks and uncertainties. Accordingly, LaSalle does not make any express or implied representation or warranty, and no responsibility is accepted with respect to the adequacy, accuracy, completeness or reasonableness of the facts, opinions, estimates, forecasts, or other information set out in this publication or any further information, written or oral notice, or other document at any time supplied in connection with this publication. LaSalle does not undertake and is under no obligation to update or keep current the information or content contained in this publication for future events. LaSalle does not accept any liability in negligence or otherwise for any loss or damage suffered by any party resulting from reliance on this publication and nothing contained herein shall be relied upon as a promise or guarantee regarding any future events or performance.
By accepting receipt of this publication, the recipient agrees not to distribute, offer or sell this publication or copies of it and agrees not to make use of the publication other than for its own general information purposes.
Petra Blazkova discusses our findings in LaSalle’s ECGI 2023 report.
Our latest LaSalle European Cities Growth Index (ECGI) ranks European cities with the strongest economic prospects based on data inputs of economic growth, human capital, business risk and – for the first time – extreme heat.
The 2023 edition highlights the steady strong positions of both London and Paris, which are set to account for more growth than Europe’s next nine top-ranked cities combined. Interestingly, Paris has overtaken London as the top destination for venture capital funding for the first time since LaSalle began tracking this data in 2006, receiving particularly elevated levels of investment into its technology sector.
Nordic cities appear to have an increasing advantage due to demographic trends, a skilled workforce and world-leading pharma, industrial tech and creative industries; they account for a quarter of the top 20 cities. German cities have continued to perform strongly in the index despite slow population growth. On the other hand, Rome and other Italian cities’ rankings are most negatively impacted after a new factor accounting for extreme heat days was added to the ECGI this year.
Elsewhere, Prague and Warsaw have been identified as having promising growth prospects as more expats return and high-skilled workers remain, with this “brain gain” leading them to their highest scores since the global financial crisis. The index also reflects that Warsaw is becoming an attractive place for employment in the technology sector and Prague is forecast to benefit from a jobs boom.
Brian Klinksiek, Global Head of Research and Strategy (L) and Eduardo Gorab, Head of Global Portfolio Research and Strategy, LaSalle Global Solutions (R), take a look at the why and how behind building diversified and resilient global real estate portfolios.
The art and science of portfolio construction matters most when market conditions change suddenly. This has never been truer than in the past few years, which saw major pivots in capital markets as policymakers shifted from trying to stimulate the economy at the start of the pandemic, to applying the breaks to prevent inflation running out of control. The speed and unpredictability of these changes highlights the importance of planning ahead by thinking carefully about how to create portfolios that can be expected to be resilient. Foundational concepts of portfolio management such as diversification and risk management should be considered alongside an investor’s objectives and values to devise a strategy for their portfolio.
It is with these factors in mind that we release first edition of LaSalle’s ISA Portfolio View, which seeks to answer five foundational questions about real estate:
Why real estate lays out the case for property exposure in a multi-asset context?
Why global considers the benefits of expanding horizons beyond an investor’s domestic market?
Why be sector smart tries to make sense of the recent changes in relative sector performance with an eye to building resilient portfolios?
Why be quadrant smart addresses the interplay among the “four quadrants” of real estate?
In many ways the ISA Portfolio View is the continuation of a longstanding strand of LaSalle’s analysis that would typically form the latter chapters of the Investment Strategy Annual. In this new standalone edition, we draw from a deep pool of experts from around the firm, acknowledging the interconnectedness of real estate opportunities: across borders, across sectors, and across quadrants. We welcome your questions and feedback.
Important Notice and Disclaimer
This publication does not constitute an offer to sell, or the solicitation of an offer to buy, any securities or any interests in any investment products advised by, or the advisory services of, LaSalle Investment Management (together with its global investment advisory affiliates, “LaSalle”). This publication has been prepared without regard to the specific investment objectives, financial situation or particular needs of recipients and under no circumstances is this publication on its own intended to be, or serve as, investment advice. The discussions set forth in this publication are intended for informational purposes only, do not constitute investment advice and are subject to correction, completion and amendment without notice. Further, nothing herein constitutes legal or tax advice. Prior to making any investment, an investor should consult with its own investment, accounting, legal and tax advisers to independently evaluate the risks, consequences and suitability of that investment.
LaSalle has taken reasonable care to ensure that the information contained in this publication is accurate and has been obtained from reliable sources. Any opinions, forecasts, projections or other statements that are made in this publication are forward-looking statements. Although LaSalle believes that the expectations reflected in such forward-looking statements are reasonable, they do involve a number of assumptions, risks and uncertainties. Accordingly, LaSalle does not make any express or implied representation or warranty, and no responsibility is accepted with respect to the adequacy, accuracy, completeness or reasonableness of the facts, opinions, estimates, forecasts, or other information set out in this publication or any further information, written or oral notice, or other document at any time supplied in connection with this publication. LaSalle does not undertake and is under no obligation to update or keep current the information or content contained in this publication for future events. LaSalle does not accept any liability in negligence or otherwise for any loss or damage suffered by any party resulting from reliance on this publication and nothing contained herein shall be relied upon as a promise or guarantee regarding any future events or performance.
By accepting receipt of this publication, the recipient agrees not to distribute, offer or sell this publication or copies of it and agrees not to make use of the publication other than for its own general information purposes.
Global Head of Research and Strategy Brian Klinksiek (L) and Canada Head of Research and Strategy Chris Langstaff (R) discuss how rising mortgage rates will impact the residential real estate market.
In recent editions of LaSalle Macro Quarterly (LMQ), many charts have highlighted interest rate rises. LaSalle has especially focused on the repricing of income-producing real estate that rate rises have triggered in much of the globe. But the spike in rates is also having an impact on owner-occupied residential real estate, which accounts for a much larger share of the global property pie than do institutional assets. As we release the LMQ for Q3 2023, we look at the broad implications of higher residential mortgage rates, and how they vary by country. Even if institutional investors do not directly touch owner-occupied housing, they should consider the risks (and a few opportunities) caused by these dynamics.
Higher residential mortgage rates have implications for both new buyers and existing owners. For new buyers, higher rates reduce the purchase price they can pay (assuming a fixed amount of debt service). In practice, buyers cope with this by dedicating a larger share of their income to housing, or by scaling back or postponing their home purchase ambitions. For economies in which housing constitutes a meaningful share of the economy, this can create a noticeable drag on GDP growth. It may also put downward pressure on home prices, which can have indirect wealth effects on consumer spending. (So far, house prices for key countries have held up reasonably well during this period of rising rates—as shown in the chart on page 7 of the LMQ—but risks remain.)
For existing owners, much depends on the specific terms of the mortgage. The US mortgage market is unique globally in having a very large share of loans with rates that are fixed over a fully amortizing term (typically 30 years), according to data from Fitch. Assuming they do not move, borrowers can continue to enjoy low fixed payments. Elsewhere in the world, residential mortgage rates are usually floating or fixed only for a limited time. When rates rise, they filter through to borrowers gradually as fixed rate periods end—in other words, when rates reset. Depending on the mechanism for rate resets, they can cause a direct hit to disposable incomes. Households may react to this by scaling back spending elsewhere, or in the extreme, leaving the ranks of homeownership. These impacts will be more significant in places where consumers already have a high debt service burden.
For investors in income-producing institutional real estate, there are two aspects of these dynamics that are especially relevant. One is the broad recession risk that comes from weaker housing markets and stretched consumers. Oxford Economics has cited differential exposures to mortgage resets as a driver of divergence in near-term economic growth between the US and Canada. Second, the substitution effect from owned to rented housing may provide a boost to both multifamily and single-family rental demand, potentially driving stronger performance for residential strategies.
Canada: An illustrative case
Canada is an interesting case study because the structural characteristics of its residential mortgage market and the availability of transparent data permit a relatively clear identification of mortgage rate resets. Most residential mortgages in Canada have 25- or 30-year amortization periods, with typical fixed rate periods (known as “terms”) running from as short as one year to as long as ten years, according to the Bank of Canada. Some mortgages have a fixed interest rate that is reset for the next term according to the prevailing market rate. This occurs through a renewal at the end of each term, until the mortgage is fully paid off. According to Bank of Canada (see table), fixed-rate mortgages account for two-thirds of balances outstanding in the country among lenders. Most fixed-rate mortgages have remaining terms of five years or more (40% of overall balances), followed by three-to-five years at 18.4%. Only 8.5% of all fixed-rate mortgages expire in the next three years
Composition of outstanding residential mortgage balances, Canada (April 2023)
Sources: Bank of Canada, LaSalle. Data as of April 2023.
However, the remaining one-third of Canadian mortgages are variable rate, which float based on short-term interest rate movements. The Bank of Canada has hiked interest rates nine times since March 2022, pushing up rates on some variable-rate mortgages to around 6.0%, from roughly 2.8% a year ago. The most common type of variable-rate mortgages in Canada have fixed monthly payments. As interest rates rise, a higher proportion of the payment goes toward interest and less toward principal. Rising rates over the past 18 months have put some borrowers in the position of having monthly payments that do not cover the interest portion of the mortgage. The excess (unpaid) interest for that month gets added to the principal, increasing the original mortgage amount. Compared to countries where the absolute monthly payment amount adjusts directly with rates, this mechanism prevents an immediate near-term hit to disposable income from rising rates. But it does effectively embed the impact of higher rates into a longer-term increase in debt on household balance sheets.
The rest of the world
Beyond Canada, which countries are impacted by rising residential mortgage rates? Cross-border comparisons are not straightforward; the devil is in the detail. Nuances to consider include variation in fixed-rate terms, amortization periods, interest rate levels, and when and how rates reset. Many factors, including macro indicators like household debt levels and the structure of countries’ residential mortgage markets, need to be considered in assessing a market’s exposure.
One persistent issue is that data on the relative shares of fixed- versus variable-rate mortgages by country tend to classify any mortgage as fixed rate if it is fixed for a period of time, even if it that rate will reset in the near term. Analysis by Fitch Ratings attempts to correct for this with a metric that includes any mortgages with rates that are expected to expire or reset within 24 months. On this analysis, Australia leads in exposure to resets, followed by Spain, the UK, and Canada. Australian mortgages with fixed rates generally have shorter fixed-rate periods of around two years; this compares with five years in the United Kingdom and Canada, and 30 years in the U.S. (Although not in the Fitch dataset, we understand that Sweden is also relatively highly exposed to resets.)
Share of residential mortgages originated with rates that expire or reset within 24 months
Expressed as % of 2020 loan originations. Analysis as of December 2022. Sources: Fitch Ratings
Fitch extended their analysis to combine and layer in pre-reset mortgage debt-service-to-income (“DTI”) ratios by country. This allowed them to estimate how much an increase in DTIs would be caused by a five-percentage point increase in interest rates. They found that the impact roughly followed the rank ordering above, with Australia and the UK most exposed, and the US least exposed. It should be noted that many of the same mitigating factors that apply to Canada (e.g., strong immigration, shortages of housing, low mortgage arrears) also apply to Australia, Spain and the UK.
The outlier case of the US is not quite as positive as it may appear. As a country with high internal mobility and (unlike many other markets) mortgages that are not “portable” between different collateral, the effective exposure of US households to mortgage rate changes is probably higher than implied by these data alone. Moreover, there are some downsides to having a large share of long, fixed rate mortgages. For one, the lesser impact of higher rates on consumer spending potentially requires more interest rates increases to have the same desired impact on inflation. Another factor, which is already evident, is that having a low interest rate locked in creates a barrier to moving, limiting the supply of housing for sale and making home prices sticky.
Looking ahead
As mortgages reset at higher rates, a greater share of household budgets will be diverted to mortgage payments. This could be particularly acute for households that live “paycheck to paycheck.” While some households may have excess savings to cushion the blow of higher mortgage payments, overall discretionary retail spending is at risk of moving lower. This, in turn, could impact retail real estate market fundamentals. The composition of retail spending could also shift, as households with lower discretionary incomes move more of their spending to discount retailers, and away from discretionary or luxury items. In the case of Canada, Oxford Economics forecasts that consumer spending will drop 1.8% from its pandemic-era peak, potentially tipping the economy into recession.
While interest rate hikes since early 2022 have increased financing costs for owners of multifamily apartments and reduced transaction volumes, ongoing housing shortages in various countries are contributing to higher apartment demand. With higher mortgage payments putting the cost of home ownership out of reach for many, demand for relatively lower-cost rental housing has increased. This has clearly been the case in Canada, where according to the Canada Mortgage and Housing Corporation, apartment vacancy declined by 120 basis points in 2022 as apartment absorption reached an all-time high of 100,300 units, an increase of 59% over 2021.
Sources:
1. ECONOSIGHTS: Three reasons why Australia is more vulnerable to higher rates – Mousina, Diana, AMP Capital, September 2022.
6. Mortgage Interest Payments in Advanced Economies – One Channel of Monetary Policy – Reserve Bank of Australia, Statement on Monetary Policy, February 2023
Important Notice and Disclaimer
This publication does not constitute an offer to sell, or the solicitation of an offer to buy, any securities or any interests in any investment products advised by, or the advisory services of, LaSalle Investment Management (together with its global investment advisory affiliates, “LaSalle”). This publication has been prepared without regard to the specific investment objectives, financial situation or particular needs of recipients and under no circumstances is this publication on its own intended to be, or serve as, investment advice. The discussions set forth in this publication are intended for informational purposes only, do not constitute investment advice and are subject to correction, completion and amendment without notice. Further, nothing herein constitutes legal or tax advice. Prior to making any investment, an investor should consult with its own investment, accounting, legal and tax advisers to independently evaluate the risks, consequences and suitability of that investment.
LaSalle has taken reasonable care to ensure that the information contained in this publication is accurate and has been obtained from reliable sources. Any opinions, forecasts, projections or other statements that are made in this publication are forward-looking statements. Although LaSalle believes that the expectations reflected in such forward-looking statements are reasonable, they do involve a number of assumptions, risks and uncertainties. Accordingly, LaSalle does not make any express or implied representation or warranty, and no responsibility is accepted with respect to the adequacy, accuracy, completeness or reasonableness of the facts, opinions, estimates, forecasts, or other information set out in this publication or any further information, written or oral notice, or other document at any time supplied in connection with this publication. LaSalle does not undertake and is under no obligation to update or keep current the information or content contained in this publication for future events. LaSalle does not accept any liability in negligence or otherwise for any loss or damage suffered by any party resulting from reliance on this publication and nothing contained herein shall be relied upon as a promise or guarantee regarding any future events or performance.
By accepting receipt of this publication, the recipient agrees not to distribute, offer or sell this publication or copies of it and agrees not to make use of the publication other than for its own general information purposes.
Through history, residential rent controls have tended to appear at times of external shock and dislocation.1 COVID-19 and the subsequent inflationary spike have proven to be such a catalyst. Changes to rent regulations can potentially reshape the risk-reward profile of residential investments, impacting values over both short and long timescales. As we set out in a previous piece, A New Wave of Residential Rent Control, the introduction of rent control measures can also have unintended consequences that distort the market. While often sold as a solution to spiralling housing costs, in practice they can have the opposite effect to their intent, deterring the construction of new rental housing, thus leading to further increases in rents.
Our findings in that report still hold true, but an update is needed because the “great reflation” period has seen a groundswell of support for further rent regulations, especially in Europe. The pandemic opened the door to unprecedented government intervention, and there has been a heightened willingness among politicians to introduce forms of rent control. But there continues to be vast differences across countries, regions and cities, reflecting varying political appetites for intervention. What is the impact of these recently enacted measures and which markets have been most impacted?
Rent regulation starting positions vary widely
Regulations take many different guises including broad brush limits on initial rent levels (e.g., in France, Ireland), market-wide caps to annual rental increases (Germany, Sweden) or caps limited to buildings of a certain age or in certain areas deemed to be stretched (Denmark, Catalonia, New York City, California). Beyond rent-setting, lease length, security of tenancy and eviction protections are additional factors to consider. Crucially, regulation should be viewed on a spectrum rather than as a binary determination.
In “unregulated” rental markets, such as England, most of the US and select European countries (e.g., Finland, Poland and Czechia), rents can typically be freely set at the outset of a tenancy, with the landlord permitted to increase them at the end of the agreement (typically 12 months) by any amount. This allows landlords in these markets to mark rents to market levels quickly. Even in markets that are usually considered to be unregulated, other legal limitations should also be considered; for example, the UK parliament is currently considering a law which would end no-fault evictions in England and Wales.
Elsewhere in Europe, in parts of Canada, and in several US states like California, Oregon and New York, the most typical form of rent control is limiting annual rent escalations for existing tenants. The devil is in the detail of these specific regulations. California, Oregon and New York City’s regulations, for example, apply to a subset of older assets; in Toronto (and all of Ontario) they apply to all but the newest. In the case of Oregon, a limit of 7% increase plus CPI is not much of a limitation on investment economics,2 while in New York City, rent increases are set by a regulatory body and can have a significant impact.
Europe’s generally more constraining rent increase caps mean that in-place rents are normally significantly below open-market rents for new leases. Limiting annual rent increases for in-place tenants prevents rents from being marked to market, usually resulting in tenants being “stickier”, staying in their homes in the knowledge that the rents they are paying are below what they would pay under a new lease. This has the effect of higher occupancy levels and lower expenses on unit turnover and voids. Catch-up between in-place and market rents occurs gradually, even during periods of weakness in market rents.
As a result of these factors, heavily regulated markets tend to experience stable in-place cash flow growth, without the cyclicality of less restrictive markets. This is highlighted on the below chart, which shows that residential rental growth in the UK has been far more volatile than regulated European markets. Given steady, non-cyclical growth, regulated residential in Europe has been able to deliver a higher level of long-run growth than most of the commercial sectors. These attributes of stability and low-but-dependable growth can be appealing to core investors, especially in lower inflation environments.
Rental growth and volatility
[Average per annum since 2000* and standard deviation]
Source: LaSalle (May 2023), MSCI (December 2021)
Variety of cash flows can be a positive – but beware regulatory surprises
If regulations are known and stable, they can be priced in, limiting the risks to informed investors. A bigger concern comes from new, unforeseen regulations during the ownership of an asset. So-called “stroke-of-the-pen” risks may cause underwritten rent levels and growth to suddenly change. This remains a persistent threat as long as some policymakers are willing to support new rent controls. The factors which have made residential such a compelling sector in recent years, namely the undersupply of housing and tailwinds supporting demand, have exacerbated the threat, as rents in many major markets have increased as a share of average household income. The bout of high inflation seen in 2022-23 has put even more pressure on household finances and motivated politicians to act. The result has been new regulations brought in across Europe and North America, although some are some supposedly temporary.
Another wave of new regulation—Europe
Since beginning of 2022, several European markets have introduced new rental regulations, including in Scotland, France, Spain, Denmark and the Netherlands (see map). In other markets, such as Germany, new regulations are now being discussed.
The impact of these is just beginning to play out, but they are having meaningful effects already, with significant variation by market and asset profile. During this period of high inflation, these caps have created a double hit for some residential owners, limiting rental growth at the same time as operating expenses rose quickly.
Rental regulations introduced over 2022-2023
[Lighter colored markets considered unregulated]
Source: LaSalle (May 2023)
In some markets, recent regulatory changes are less disruptive. For example, the cap to indexation at 4% in Denmark may result in below-inflation rental growth for one or two years. Should inflation revert to historic levels as anticipated, this is unlikely to meaningfully damage performance on assets held over the long term, but potentially mean negative real cashflow growth for landlords in the near term. This is because inflation exceeded the cap in 2022 and will expect it will likely do so again in 2023. Residential assets in regulated markets have only been able to deliver inflationary in-place rent growth when inflation is at “normal” levels. This is because regulators in Denmark and elsewhere have tended to prevent double-digit nominal increases even when justified by inflation.
The Scottish government’s decision to ban rent increases completely in September 2022 was potentially more disruptive. Some developers and investors indicated that construction of badly needed new for-rent supply was not viable in such an environment. Being unable to underwrite rental growth would likely discourage private investment in Scotland’s housing market, exacerbating the housing shortages which necessitated the rent controls in the first place. The Scottish government backtracked in April 2023, replacing the freeze with a still tight 3% cap.
Once regulations are introduced they are often very difficult to unwind, as few politicians will publicly campaign to reverse policies which will result in their voters paying more in rent. Evidence of this can already be seen in Spain, which introduced supposedly temporary caps to rent increases that have been extended beyond their original end dates and has further tightened regulations with the introduction of a wide-ranging national housing law.
Less constraining changes in the US
In parts of the US, rent control gained traction in the late 2010s, reversing a two-decade trend toward less regulation. But most cases, new measures have been relatively mild. In 2019, Oregon and California enacted statewide caps on annual rent increases for existing tenants, but limited the restrictions to older properties and set the level of the caps high.3 A notable example of a more severe new rent ordinance comes from St. Paul, Minnesota. Voters there approved an ordinance in 2021 that limited rental increases to 3% across all buildings and for renewals and new leases alike. Developers responded by halting construction projects in the city, with residential permits falling by 30%. Less than a year later, the St. Paul city council revised the ordinance to more closely resemble the legislation in California and Oregon.4
Despite the advances of rent control legislation in a small number of states and cities in recent years, many more jurisdictions have rejected it. In 2022 alone, new rent regulations were introduced by state legislators in 19 states and did not receive enough support to pass. Most recently, in April 2023, Florida passed an outright ban on rent control in that state while at the same time allocating new funding for the development of affordable housing.
Living with increased regulation
Despite the risks of regulatory change, regulated residential assets can potentially offer investors a favourable return given low risks, particularly when compared to the more challenged office sector. That said, the devil is in the details, given widely varying regulatory frameworks across cities, states and countries. With changes to policies underway, managing the risks of greater regulation is now more important than ever for investors. To do so, we recommend an approach that encompasses vigilance, diversification and identification of less-regulated proxies for residential—we detail each of these strategies below.
Looking ahead
Be vigilant of shifting regulations impacting both current and potential investments. Assessing the likelihood and timing of new legislation is an extremely difficult task but is a prerequisite when screening any potential acquisition in the sector.
Diversify exposures across markets with differing regulatory regimes, limiting the impact of a single change in legislation to a portfolio.
Require higher returns to compensate for future regulatory risk. The lack of certainty on regulations necessitates that investors to add an extra level of uncertainty to their future cashflows, potentially requiring additional risk premia at both acquisition and exit.
Consider whether other Living sub-sectors may be less likely to be brought under the scope of rent controls. For example, in European purpose-built student accommodation (PBSA) operates with very limited restrictions on rents, even in the most tightly controlled markets. Because European universities tend to be clustered in major cities, PBSA offers investors some of the same compelling attributes as traditional residential—a chronic supply-demand imbalance, short leases allowing for rapid capturing of rental growth and further maturity as an asset class to come—but with lower regulatory risk. Similarly, shorter-stay co-living and serviced apartment stock may fall outside the regulation of traditional apartments.
The earliest record of rent control dates to the Roman Empire. Notable shocks that were a catalyst for new rent regulation included the Chinese Song dynasty’s relocation to its new capital city in 1127 and the period immediately following the Great Lisbon Earthquake of 1755. See Kholodilin’s fascinating review of historic rent control at this link.
On the other hand, changes in eviction protections in Oregon have been significant; this is a reminder to consider non-rent aspects of regulation.
California’s law caps annual rent increases at the lower of CPI+5% or 10% while Oregon allows for 7% plus the rate of inflation.
The revised St. Paul ordinance exempts buildings less than 20 years old and allowing for increases of CPI plus 8% for new leases.
The state of the market year-to-date: Capital markets digest repricing, as tenant demand stays resilient and energy markets deliver a positive surprise.
Our latest LaSalle European Market View shows how Europe’s economies and real estate markets are being impacted by, and adapting to, the current period of unusual uncertainty.
This update highlights recently released data on how Europe’s energy market has coped with shutoffs and surging prices in the winter following Russia’s invasion of Ukraine. It did so through a combination of reduced consumption (p. 6), more electricity generation from renewables (p. 7), and shifting to imports from new sources (p. 8). In Q1, the EU’s natural gas consumption was tracking 18% below average. This owes some thanks to mild winter temperatures, but also to conscious conservation efforts.
Natural gas consumption in Europe (EU27)
Source: LaSalle analysis of Eurostat data to March 2023. Note that the UK is excluded from all time series data above.
Falling energy prices have led to recent steep headline inflation declines (p. 11) and kept Europe’s largest economies from entering recession to date (p. 9). Yet core inflation – excluding volatile food and energy – is higher today than in 2022 – and GDP growth is at stall speed. European banks have weathered the aftershocks of SVB’s failure and the Swiss National Bank’s forced resolution of Credit Suisse. However, some pullback in bank risk appetite is evident in debt markets (see p. 29 and our April ISA Briefing).
Even as the ECB and Bank of England’s rate hikes have continued, long-term swap rates today are similar to where they started the year (p. 28). This has given private real estate and yields some time to digest the new repricing math. The UK’s repricing stands out for its speed, with monthly UK index data swinging to a positive return in March after eight months of deep negative returns (p. 34).
European real estate transaction volume declined to an 11-year low in Q1. This is a lagging rather than concurrent indicator, however, and reflects the high uncertainty and bid-ask spreads that existed near the end of 2022. At the same time, the most recent Q1 data on occupier trends shows hardy demand fundamentals, albeit with some cooling. In Q1, prime logistics rents continued to grow at a double-digit annualized pace and UK residential sector kept pace with high inflation across many markets, even as office rents cooled and retail rents were flat. As we look ahead, we believe the relationship between current vacancy and its historic levels (p. 18, 20, 21) points to the European property types and markets where rent momentum is most likely to continue.
Quarter-over-quarter rental growth in Europe
*Average rent and Q1 2023 residential data currently unavailable. UK residential rent data is based on new listings (rather than in-place rents). Source: JLL, HomeLet data to Q1 2023. Latest as of May 2023.
US private real estate returns went negative in Q4 2022 as the impact of higher interest rates continued to ripple through to market pricing and appraised values. This trend is expected to continue through the first half of 2023 with stability projected to return later in the year.
Returns in the fourth quarter showed negative appreciation and income returns in line with previous quarters, resulting in negative total returns for both the NPI and ODCE. The slowdown in returns was most significant for industrial, with retail delivering the highest returns of the major sectors (this is a notable shift from trends of the last 5+ years). Looking ahead, the dominant theme in sector performance is expected to be the under-performance of offices.
This note provides details on the fourth quarter performance of the NPI and ODCE indices, summarizes the outlook for future returns, and provides some information regarding insights from the first release of data related to the new NCREIF subtypes.
Highlights from the Q4 data releases include:
The quarterly total NPI return declined 410 bps from Q3 to -3.5%. The Q4 return comprised a 0.95% income return and -4.45% appreciation return.
The trailing-year return declined more than 1,000 bps quarter-over-quarter to 5.53%.
Returns for all property types were down from the previous quarter and in negative territory, with industrial seeing the greatest decline for the second consecutive quarter. Retail was the highest-returning property type for the first time since Q1 2016.
The ODCE value-weighted quarterly gross total return of -4.97% was down 440 bps from the third quarter. Appreciation remained negative at an index level and the income return was flat at 0.80%, an all-time low. Mark to market on leverage was a positive as interest rates rose, but negative appreciation caused leverage to be an overall negative to returns.
Global Head of Research and Strategy Brian Klinksiek discusses recent bank failures and the impact on real estate with Dominic Silman and Zuhaib Butt.
Silicon Valley Bank (SVB) and Signature Bank failed. Regulators hastily arranged the sale of Credit Suisse to UBS. Concerns spread about numerous other small and major global banks including Deutsche Bank. Recent events have raised fears that the global economy is in for a credit crunch of unknown magnitude and duration. As we release our first LaSalle Macro Quarterly (LMQ), a revamp of our long-standing “macro indicators deck,” banking sector strains represent the number one macro risk we are assessing.
The proximate cause of each recent bank failure was deposit flight, a drain from the liabilities side of the bank balance sheet. This is fundamentally not a toxic assets problem of the sort that banks faced in the Global Financial Crisis (GFC). Rather, it is a liquidity issue that can be addressed by temporary emergency funding from central banks. But solvency, the greater concern for banks in the longer run is closely tied to the duration of the asset book.
When investors in interest rate-sensitive assets refer to duration, they typically mean the change in value associated with a change in risk-free rates. SVB failed, in large part, due to a perception that it had sustained severe losses on riskless (but long-duration) US Treasuries and near-riskless agency mortgage-backed securities as these assets had mechanically repriced in the higher interest rate environment.
Just as there was a mechanical element to the initiation of this crisis, there is a mechanical feedback loop that can help the crisis partially self-resolve. As worries around bank solvency, credit conditions and the real economy spread, expectations for policy rates fell, causing long-duration assets to once more increase in price, shoring up balance sheets.
As a result, there has been a 360-degree round trip in interest rate forward curves between the beginning of February and the end of March. At first, curves shifted upward due to spiking inflation data, before falling substantially as banking systems came under pressure, followed by a return to the status quo as resolution measures stabilized markets and inflation seized the attention of policymakers and investors once again. As a result of this volatility in rate expectations, the MOVE index of bond option volatility1 has reached the highest levels since the GFC.
There are many media, economic and financial industry sources to turn to for a deeper discussion of the underpinnings of the recent financial sector instability, or to track the daily news flow and the resulting volatility. Our focus is on the practical considerations for investors in property. We have identified four key recommendations for how real estate investors can assess risks and manage through volatility.
1. Don’t miss the forest for the trees.
A lot of analyses have focused on idiosyncratic aspects of individual banks. For example, Silicon Valley Bank has been highlighted for its tech sector links and an unusually large share of its deposits not covered by deposit insurance. Credit Suisse had faced multiple controversies in recent years, including a recent disclosure of reporting irregularities which triggered an equity sell-off, as well as an outsized exposure to losses in cryptocurrencies.
Fundamentally, however, the current pressures impact all banks, with the weakest links facing the greatest strain. The question is: How far beyond those weakest links will the challenges spread? This will depend on how the vagaries of sentiment and fear interact with the willingness of policymakers to take action to protect the banking system. Thus far, action taken to resolve liquidity issues seems to have had the intended stabilizing effect, with banks such as Deutsche tested, but not forced to failure.
2. Monitor the path of monetary policy and bear in mind duration.
Central banks meeting at the end of March faced a dilemma between continuing their path of tightening to fight inflation, versus moderating or pausing to prioritize financial stability. In the end, the European Central Bank (ECB), Federal Reserve (‘Fed’) and the Bank of England (BoE) all opted to press ahead with rate rises2. Their decisions were helped in part by data showing an unexpected re-acceleration in inflation, and perhaps also wishing not to betray significant concern about the stability of financial systems.
Volatility in rates markets has a symmetric aspect, so both the initial fall in expectations and the return to a higher implied path for rates have contributed to the MOVE index reaching decade highs. Research suggests3 that bond volatility is less tied to meeting-by-meeting central bank decisions, which may be well-telegraphed, and more to expectations about the ‘terminal’ rate—the highest level that policy rates will reach over a cycle. As we near that peak rate, bond options are more sensitive to news at the margin than they were even to 75bp rate increases when it was well understood that the terminal rate was still far higher.
Long duration—and therefore high sensitivity to interest rates—is a characteristic not just of bonds, but any long-hold assets with uncertain cashflows, including income-producing real estate. It follows that real estate values, especially in sectors and geographies which have repriced furthest and most quickly such as UK industrial, are also more tightly linked to terminal policy rates at this point than month-to-month central bank decisions.
3. Take an active approach toward real estate debt.
Bank lending is likely to become more conservative as duration risk attracts both external regulatory attention and enhanced internal risk management scrutiny.Any pullback in bank lending activity should further increase the importance of private credit across the economy, including in real estate. This could be beneficial to non-bank lenders funded by sticky capital, who can be expected to originate a greater proportion of mortgage loans. On the equity side, investors should cautiously manage their debt maturity schedule in the near term and diversify their sources of debt capital over the medium term.
4. Manage risk and diversify.
The failures of SVB, Signature and Credit Suisse, and the pressures on other banks, have elicited a policy response that some banking experts consider to be sufficient to prevent severe additional damage to the economy. Certainly, rate-setters have felt sufficiently confident to press ahead with policy rate increases. But as in all cases of banking sector turbulence, there is considerable uncertainty and outcomes will depend on difficult-to-predict sentiment factors. Ultimately, the systemic nature of financial market risks makes them inherently difficult to control. As real estate managers and investors, our best approach is to understand and monitor these risks and practically diversify investments to mitigate the impact on the overall portfolio.
Looking ahead
We recommend focusing on the overall health of the financial system, rather than sector-specific concerns, such as sizing incremental negatives on tech-related real estate from the failure of SVB. Surely, the loss of a sector-focused relationship lender will have some impact on tech companies. But well before the failure of SVB, the same duration-driven hit to the value of bonds and real estate was affecting early-stage technology companies. We do not think the incremental negative for tech is as important as the broader macro uncertainties.
Investors should bolster their monitoring of banking health generally and their banking relationships specifically. This includes careful mapping of where deposits are held and sources of debt finance, especially credit lines. These exposures should then be continuously compared to assessments of bank health and market measures of risk, such as credit default swap (CDS) spreads4 and Liquidity Coverage Ratios (LCRs). LaSalle has undertaken a comprehensive global exercise to match such exposures and compare them against a dashboard that tracks the health of close to 100 major banks globally.
Footnotes: 1 [LMQ slide 3], 2 [LMQ slide 4], 3 Based on work by Natixis, a French corporate and investment bank, 4 [LMQ slide 6]
Value investing in European real estate today is characterised by an abundance of unmeasurable uncertainty over quantifiable risk. Successfully navigating that uncertainty requires the intersection of expertise and experience.
Beyond the current turmoil however, we believe four themes will define the Europe of the near future – Europeans will be smarter, greener, older and more mobile.
Periods of dislocation, while testing for investors’ convictions, can also offer opportunity. Uncertainty can result in attractive entry pricing as markets become over-correlated. As a result, fund vintages raised during challenging markets, which are able to take advantage of this repricing, have outperformed in recent cycles.
Where short-term dislocation overlaps with our long-term convictions, we believe lasting value can be created.
Thanks for your submission. This report has been expertly crafted with insights
gleaned from the knowledge and expertise provided by LaSalle Investment Management’s
research team.
Brian Klinksiek and Fred Tang on China’s great reopening means for property markets in China and around the world.
What it means for Chinese and global property markets
After nearly three years of enforcing a comprehensive approach to COVID-19, involving frequent testing, rigorous contact tracing and strict border quarantines, China unexpectedly ended its zero-COVID policy in early December 2022.
After an initial period of surging new infections, by mid-January 2023 the situation had improved substantially. Most recently, cases have fallen sharply as the virus has already infected a large share of the population. Life in China is quickly returning to normal, as evidenced by rebounding subway passenger volume and rising road congestion.1 This return to pre-pandemic normality has meaningful implications for the economic and real estate outlook in China, the broader Asia-Pacific region and the world.
Road congestion and subway passenger volume in Tier I cities in China
1 Source: Amap.com via WIND Economic Database (road congestion index), WIND Economic Database (subway passenger volume), as of 15 Feb 2023)
China: Unambiguously positive for growth
China’s reopening provides a clear boost to the Chinese economy, and high-frequency indicators suggest it may have already started to recover. The official manufacturing PMI and non-manufacturing PMI both returned in January 2023 to above 50, the dividing line between expansion and contraction, after hitting the lowest levels since March 2020 in December 2022.2
Meanwhile, among the 70 cities tracked, 36 experienced increases in for-sale residential prices on a quarterly basis in January 2023, compared with only 15 cities in December 2022.3
Unlike China’s V-shaped recovery from the initial COVID-19 outbreak in 2021, the rebound this time is likely to be gradual and mild. There are two factors supporting that expectation. First, despite the reopening and a shift in government policy towards promoting growth, it could take some time to repair the balance sheets of Chinese businesses and households, which are fragile after nearly three years under the zero-COVID regime. Second, the country’s for-sale residential sector, historically a main driver for the economy, remains weak despite signs of bottoming.
2 National Bureau of Statistics of China (NBS)
3 National Bureau of Statistics of China (NBS)
Asia-Pacific: Outbound travel likely to be key
Looking to the broader Asia-Pacific region, China’s reopening is an encouraging development for the hospitality industry. Since March 2022, hotel revenue per available room (RevPAR) had been gradually improving in countries which were advanced in their post-COVID reopening, particularly Australia and Singapore.4
However, Chinese visitors historically have been a significant source of hotel demand and visitor spending in major Asia-Pacific markets, and they were almost completely absent in 2022. As such, hotel performance in most tourism destinations of the region is still trailing the pre-pandemic level. As China unleashes pent-up demand for travel, a recovery in Asia-Pacific hotel and tourism-oriented retail sectors is likely.
4 The Singapore Tourism Board, The Hong Kong Tourism Board, as of Dec 2022
International visitor arrivals and the proportion from China5
5 The latest data on international visitor arrivals to (1) the U.K. are as of September 2022, (2) Australia, Germany, and the U.S. are as of November 2022, and (3) Hong Kong, Japan, Singapore, and South Korea are as of December 2022. The data on the proportion of international visitor arrivals from China for all countries are as of 2019 except Germany which is as of 2018. Source: Statista and CEIC (Germany), as of 2018; the U.K. Office for National Statistics (the U.K.), as of September 2022; the Australian Bureau of Statistics, the U.S. Department of Commerce, as of November 2022; the Hong Kong Tourism Board, the Japan National Tourism Organization; the Singapore Tourism Board; the Korea Tourism Organization, as of December 2022.
Global: Incrementally inflationary or boost to supply chains?
The impact of China’s reopening on the global economy will depend on the interplay of two opposing factors. On the one hand, higher demand from stronger growth in the world’s second-largest economy could potentially increase global inflation, or at least keep it high for some time.
On the other hand, the smoother operation of global supply chains from a fully reopened China is potentially a counterbalancing disinflationary trend. Indeed, an end to the start-stop impact of lockdowns on production and transportation should reduce the risk of further supply chain shortages.
Our expectation of only a gradual recovery in the domestic economy means that the hit to global inflation may not be significant. Weaknesses in the Chinese housing market is likely to prevent too much upward pressure on global construction costs from materializing, even though China is the world’s largest steel exporter. But any boost to inflation, just as it is starting to come down in much of the world, would be unwelcome and could mean that global central banks might not be able to stop raising interest rates as soon as otherwise.
Looking ahead
The reopening is expected to boost occupier and investor demand for commercial real estate in China. Improving real estate fundamentals and domestic investor sentiment, along with low domestic interest rates and the rapid growth of the domestic public REIT market, points to increasing capital market liquidity among domestic investors for Chinese commercial real estate assets in the near term. The logistics and multifamily rental sectors are expected to benefit from this trend the most due to their relatively sound fundamentals, their qualification for domestic public REIT structures and other supportive government policy measures.6
In the Chinese culture, the Year of the Rabbit signifies prosperity, peace and longevity. While the world is still facing many challenges including elevated inflation, higher interest rates, the risk of recession and the Russia-Ukraine war, the reopening in China in the Year of the Rabbit brings clear positives to the Chinese economy and its real estate markets, though the risk of a renewed rise in global inflation should be watched carefully.
6 Among the major commercial real estate sectors, currently only industrial and multifamily rental assets are qualified underlying assets for ownership by domestic public REITs.
Brian Klinksiek, Petra Blazkova and Hina Yamada discuss how energy prices are affecting real estate values.
We property strategists are accustomed to working with traditional real estate variables such as net absorption, rental growth and vacancy rates. But in the early days of the COVID-19 pandemic, there was no choice but to go on a crash course in previously unfamiliar epidemiological concepts like positivity rates, R-naught¹ and vaccine effectiveness, as these suddenly became drivers of short-term real estate conditions. Over the past year, real estate researchers have likewise had to quickly scale a learning curve in understanding energy markets. For the first time ever, we produced charts denominated in once esoteric units of measurement like therms, MMBTUs and MWhs.²
Gas, electricity and oil prices have long been linked to real estate outcomes—energy crises sparked 1970s inflation and have shaped real estate demand from Alberta to Texas and Scotland. But when supply is predictable and prices moderate, as in the years before the pandemic, those links can become dormant. They have awoken again in the past year. The recent dramatic but uneven volatility in energy prices has deeply influenced the economic and property market outlook—especially in Europe—and we expect it to continue to do so going forward.
Europe’s cold, dark winter turns brighter
One year on from Russia’s invasion of Ukraine in February 2022, European energy markets have proven adaptable, facing down a unique degree of energy disruption owing to the region’s dependence on pipeline links from Russia. After initially skyrocketing—European natural gas price at their peak were twelve-times higher relative to the ten-year, pre-conflict average—by mid-February 2023 prices it had fallen to a level only around two and a half times that long-term average.³ Government schemes to partially socialize the cost of higher energy, at the expected expense of massive government deficits and higher borrowing costs, now look a lot less extreme.
¹ R0 is the basic reproduction number, which describes the expected number of cases of an infectious disease directly generated by a single case, in a population where all individuals are susceptible to infection. ² 1 therm = 100,000 British thermal units (BTUs), a measure used in UK natural gas pricing. 1 MMBTU = 1,000,000 BTUs, which is used in US gas pricing. 1 MWh = 1,000,000 watts of electricity over one hour, used in European pricing of natural gas. ³ Refinitiv, Natural Gas TTF (Title Transfer Facility) historical front month futures as of 13 February 2023
Source: New York Mercantile Exchange and Intercontinental Exchange data via Bloomberg. As of 1 February 2023⁴
Relatively warm weather, cutbacks in consumption and alternative sources of energy, such as renewables and the global liquified natural gas (LNG) market, have contributed to unusually full gas storage reserves. German wind, solar, biomass, hydro, and other renewables generated 47% of the country’s electricity in 2022, a five-percentage point rise in mix.⁵ This allowed European energy prices to fall and has caused headline inflation to ease substantially, even if European core inflation remains stubbornly high. This has brightened the region’s economic prospects as well; our call in the ISA Outlook 2023 (published in December 2022) that a European recession was “almost certainly underway” now appears premature.
Is Europe out of the woods? Far from it. The winter is not yet over, and a cold snap could quickly deplete gas storage reserves. Going into next winter, the Russian supply that was used to partly fill those tanks last autumn will likely be completely unavailable. Meanwhile, Chinese demand for LNG, which was down by 20% in 2022 owing to the country’s zero-COVID policy⁶, is likely to rebound as its economy reopens, leading to more competition for tanker deliveries. Europe’s energy reorientation will probably be at least a decade-long process, which will not be reduced in scope, scale or difficulty by one fortuitously warm winter—though new LNG import capacity and suppliers have accelerated the shift in the past year. We expect that energy prices will continue to have deep impacts on Europe’s economy and real estate markets.
⁴ TTF future prices have been used as a benchmark for European natural gas prices due to being the most liquid gas trading hub in Europe ⁵ German Environment Agency (UBA), press release from 12 December 2022 ⁶ International Energy Agency (IEA), report from November 2022
Beyond Europe
While Europe’s historic reliance on Russian fossil fuels makes it uniquely exposed to energy risks, we see energy as a relevant, if variable, factor for global real estate. This is in part because energy markets operate at both global and regional scales. The Ukraine crisis caused an acute surge in European gas prices, but also a worldwide spike in the price of oil, which trades in a more globalized marketplace. It is worth noting that Canada and now the US are in aggregate net energy exporters, meaning increases in energy costs can be a net positive for economic growth in metro areas with concentrations of energy companies.
Energy and real estate
Going beyond the macro, the impact of energy costs on real estate varies greatly by building type. Data centers, cell towers, hotels, and cold storage are especially energy-hungry property types, and ones where operational business models mean landlords may be directly exposed to energy costs. Residential sectors vary widely, depending on the age and energy efficiency of the stock, the nature of building systems and leasing conventions. For example, the bulk of the older German residential inventory is heated by gas-fired boilers providing steam heat, and tenants pay “warm rents”—meaning the landlord is responsible paying for heat. Individually metered, modern multifamily product is more insulated—literally and figuratively—from energy prices.
Investments in commercial real estate sectors with net lease structures under which tenants pay energy bills directly, such as office and logistics, may appear shielded from energy volatility. But tenants in places where energy prices have surged have become painfully aware that these costs, historically a small portion of their total expense of occupancy, can suddenly become a significant burden. In our European portfolio, we have for the first time received requests from tenants to help lower their energy bills. Indeed, working with occupiers to improve efficiency and to generate on-site energy to reduce these bills has become an important way to retain them and maximize the affordability of the net rents they pay.
The limitations of electrical grids are also influencing property markets. The availability (or unavailability) of power is already shaping location decisions globally for energy-consumptive uses like data centers, and can be a constraining factor on building electrification, a key step in decarbonization. Weather events can intersect with the nuances of energy supply to cause blackouts, such as occurred in Texas in February 2021 and recently in parts of China, potentially putting a premium on buildings with backup sources of power.
These are just a few of the ways that energy risks have become closely intertwined with real estate investment outcomes. We expect to be following these issues more closely in the years ahead.
Looking ahead
Real estate investors must begin to include energy factors in identifying target markets and sectors. For example, in Europe we have developed the LaSalle Energy Vulnerability Index (LEVI) which joins our European Cities Growth Index (ECGI) and other tools as an input to our market selection decisions. LEVI combines indicators such as the sources of energy by country, energy intensity, domestic energy consumption and import dependency, to assess countries’ relative susceptibility to energy shocks. LEVI is just an initial approach to assess energy risks. Because there is intuitively a strong correlation between climate transition risks and energy vulnerabilities, the approach we take in reflecting both sets of risks in our models may eventually converge into a unified approach.
Expensive energy is a big additional incentive for installing on-site renewables such as solar and wind-generating capacity. Tenants are big beneficiaries of this because these initiatives tend to cut their gross occupancy costs. Landlords also capture some of this value by being able to charge a higher net rent, all else equal. This comes in addition to the premium we see the real estate capital markets placing on such building features, owing to their alignment with regulatory trends and the goal of decarbonization.
US private real estate returns weakened considerably in 3Q 2022 as higher interest rates continued to have a major impact on market pricing and appraised values. This trend is expected to continue in the remainder of 2022 and into the opening quarters of 2023. This is leading to a dramatic slowdown in returns from the record levels seen less than a year ago.
Returns in the third quarter showed negative appreciation, with total returns remaining positive for both the NPI and ODCE. The slowdown in returns was most significant for industrial, with apartments delivering the highest returns. Looking ahead, the dominant theme in sector performance is expected to be the under-performance of offices.
This note provides details on the third quarter performance of the NPI and ODCE indices, summarizes the outlook for future returns, and provides some information regarding insights from the first release of data related to the new NCREIF subtypes.
Highlights from the 3Q data releases include:
The quarterly total NPI return declined 260 bps from 2Q to 0.6%. The 3Q return was a 0.93% income return (an all-time low), and the appreciation return went negative for the first time since 3Q 2020 at -0.37%.
The trailing-year return declined more than 500 bps quarter-over-quarter to 16.08%, which is still high relative to history.
Returns for all property types were down from the previous quarter, with industrial seeing the greatest decline. For the first time since 1Q 2016, industrial was not the highest-returning property type.
The ODCE value-weighted quarterly gross total return of 0.52% was down 430 bps from the second quarter. Appreciation turned negative at an index level and the income return continued to fall to 0.81%, an all-time low. Mark to market on leverage was a positive as interest rates rose, but negative appreciation caused leverage to be an overall negative to returns.
As macroeconomic and geopolitical trends generate concern, investors are weighing the impact of inflation, rising rates and an uncertain economic outlook. Clarity remains elusive in many areas of real estate, but LaSalle’s Insights, Strategy and Analysis (ISA) Outlook 2023 makes the case that looking through the acute phase of volatility can lead investors to find patterns and identify opportunities.
As the 2022 Investment Strategy Annual predicted, two areas of continued strength are the residential (encompassing both single-family rental and apartments) and industrial sectors, which continue to see healthy fundamentals. But, as the report notes, price discovery across the market remains difficult, and many sellers are anchoring to aspirational “peak” pricing, perpetuating a bid-ask gap and reducing transaction volume.
The report “looks through” this current period of volatility to a potentially more positive second half of 2023 and 2024 as economic growth recovers and new supply remains limited, potentially providing a rebound in rent growth for investors with holdings in sectors that are underpinned by solid fundamentals.
Brian Klinksiek, incoming Global Head of Research and Strategy at LaSalle, said: “Crises go through phases, but we humans are wired with recency bias that causes us to worry that short term pain could last forever. However, we’ve been through up and down cycles before, and we will eventually enter a more stable phase in the capital markets. Even now there remain opportunities within real estate for well-capitalized investors who understand the nuances of local markets and sectors.”
Select ISA Outlook 2023 findings for North America include:
Inflation and higher rates continued to be key headlines in 2022. Many investors slowed transaction activity due to worries about the cost of capital. Many leveraged buyers were sidelined and may continue to be in early 2023. Expectations are interest rate pressures may start to ease, though this may come at the expense of a recession in Canada and the US early next year. The report lays out an expectation of returned economic growth in 2024 more in line with pre-pandemic norms.
A “post-pandemic steady state” has emerged, with lockdowns in the region now in the rearview mirror and data showing people exhibiting pre-pandemic levels of activity – at least when it comes to leisure. Hospitality has benefitted from this rebound, and well-located convenience retail is getting an uplift. Office, however, remains negatively affected. The report discusses the weak return to office in the US and Canada, and the dim outlook for office performance in the next several years.
Industrial, single-family rental and apartments have much stronger fundamentals than office, though they are still impacted by rising interest rates. The expectation is these sectors will produce positive rent growth in 2023, albeit below the 2021 and 2022 inflation-fueled spike. Meanwhile, medical office is a haven for investors given its resilience to economic cycles.
Market selection must now include assessment of climate risk exposure. Hurricane Ian, potentially the costliest hurricane in US history in terms of damages, was a reminder that climate risk will impact asset performance in a variety of ways.
Rich Kleinman, Co-CIO and Head of Research & Strategy for the Americas at LaSalle, said, “While private real estate is often slower to re-price than public real estate, it is impacted by the same capital markets pressures driven by inflation and rising interest rates. In the short term, we expect price discovery to be slow in the US as both buyers and sellers have shifting price expectations. However, we believe this uncertainty can produce opportunity if you have the right insights on markets and sectors. This will be challenging and will require investors to weigh short-term value with long-term portfolio objectives.”
Chris Langstaff, Head of Research & Strategy for Canada at LaSalle, said, “We anticipate some short-term softening in the Canadian economy, especially given that household wealth is closely tied to home prices. However, Canada’s high levels of immigration will help the country with a more rapid recovery and the demand generated will allow real estate markets to quickly recover.”
About LaSalle Investment Management | Investing Today. For Tomorrow.
LaSalle Investment Management is one of the world’s leading real estate investment managers. On a global basis, LaSalle manages approximately $79 billion of assets in private and public real estate property and debt investments as of Q3 2022. LaSalle’s diverse client base includes public and private pension funds, insurance companies, governments, corporations, endowments and private individuals from across the globe. LaSalle sponsors a complete range of investment vehicles including separate accounts, open- and closed-end funds, public securities and entity-level investments. For more information, please visit http://www.lasalle.com, and LinkedIn.
Forward looking statement
NOTE: This information discussed above is based on the market analysis and expectations of LaSalle and should not be relied upon by the reader as research or investment advice regarding LaSalle funds or any issuer or security in particular. The information presented herein is for illustrative and educational purposes and is not a recommendation, offer or solicitation to buy or sell any securities or to adopt any investment strategy in any jurisdiction where prohibited by law or where contrary to local law or regulation. Any such offer to invest, if made, will only be made to certain qualified investors by means of a private placement memorandum or applicable offering document and in accordance with applicable laws and regulations. Past performance is not indicative of future results, nor should any statements herein be construed as a prediction or guarantee of future results.
Company news
Jun 18, 2025 LaSalle acquires Ruby Stella Hotel in Clerkenwell
The five-building industrial complex was acquired on behalf of the LaSalle Property Fund.
Feb 11, 2025 Kunihiko Okumura and Steve Hyung Kim appointed Asia Pacific leaders
Keith Fujii to assume the role of Chairman of Asia Pacific, with all changes to be effective July 1, 2025.
Make sure you’ve spelled everything correctly, or try searching for something else. If you still can’t find what you’re looking for, you can always Contact us to talk to someone.
In 2016 LaSalle added “E” or Environmental factors to the demographics, technology and urbanization (DTU) set of secular forces real estate investors need to focus on for delivering positive long-term performance. As with other secular forces the “E-factors” are long-term in nature and live beyond the cyclical market shifts that drive near-term performance.
The early nature of the decarbonization process—both pledges and regulation—creates risks and opportunities. Catching a secular trend too early or too late in its trajectory are both risky. Our view is to move carefully and deliberately to mitigate portfolio risk and maximize returns. The net zero carbon (NZC) movement will impact different markets and segments at different points in time. The most important lesson is to pay close attention to how the trend affects specific projects and investment decisions.
Inflation has moved rapidly from overlooked to top-of-mind this year. For the past eight months, many different types of price movements have received significant attention among economists, central bankers and real estate owners and occupiers. Global supply chain bottlenecks and pandemic-related fiscal and monetary stimulus have all contributed to price instability. More recently, Russia’s invasion of Ukraine has been a particularly troubling cause of energy price volatility, especially in Europe.
Many countries are transitioning their energy grids to more renewable sources, but a full transition could take several decades. Fossil fuels supply about 77% of the world’s energy, according to the Environmental and Energy Study Institute (see p. 7). The chaotic collision of inflation and energy shortages – particularly in Europe – has decision-makers scrambling as winter approaches.
The disruption of Russian natural gas flows to Europe prompted delegates of the European Union to discuss solutions and to wean itself from Russian gas. Some are promoting a common price cap on all gas imports, while others believe this will limit supply, further stressing consumers and businesses. As winter approaches, strategic reserves in Europe are at full storage capacity (see p. 45 Gas Storage), so an immediate crisis has likely been averted. However, it remains unclear how these reserves will be replenished once they are depleted. Our analysis of this rapidly-changing situation in Europe can be found on p. 9 of this month’s deck.
Energy inflation is also impacting lease agreements between real estate owners and occupiers. Green Street Advisors recently noted that on average, energy costs to either the owner or tenant equals roughly 6% of total rent or USD ~$2.00 psf in both the US and EU. But with energy costs having risen sharply, the question becomes: who bears the cost?
In North America, most commercial leases are triple net, with tenants responsible for utilities, taxes, maintenance, and insurance. Triple net leases are also prevalent among retail properties in the US and Canada, but Canada also has gross, semi-gross or base-year leases which are indexed to CPI inflation. While tenants pay directly for their energy usage, owners are not fully off the hook as they bear responsibility for vacant spaces. Owners can also mitigate cost risk through guaranteed maximum price contracts for certain utilities.
Leases in the UK are also generally on a net basis. However, to counter rising prices, tenants have been renegotiating rents based on total occupancy cost, thus the property owner becomes responsible for any costs that exceed a threshold. In this regard, UK tenants have been increasingly seeking different lease structures that are effectively gross in nature, with shorter lease terms (see p. 10).
On the European continent, most commercial leases are fully indexed to inflation annually. Larger retail tenancies such as grocers often have bargaining power and can negotiate an index cap or lower indexation levels. But even with indexation, tenants are becoming more sensitive to utility costs and are negotiating for increases to be capped. In Japan and China, fixed-term leases typically put the burden of paying higher utility costs on the tenant, but landlords must be careful to keep total occupancy costs under control or a downward reset to the base rent could be the only way to get a tenant to renew.
Despite progress in transitioning energy grids to renewables in many countries, the world remains largely dependent on fossil fuels to provide the power to heat and cool buildings. Rising energy prices are testing the tenant-landlord relationship and the balance of power is rapidly shifting in favor of tenants, especially in weaker sectors like mall retail and offices.
London ranks as Europe’s leading city for projected real-estate occupier demand for the sixth year running in the latest annual edition of the European Cities Growth Index (“ECGI”, formerly the European Regional Growth Index, or “E-REGI”). Following closely behind, Paris retains its position as one the “Big Two” European cities owing to its position as one of Europe’s key innovation and technology hubs.
While London retains its top position, its ECGI score worsened compared to last year, due to pressures on GDP growth. In 2022, the ECGI score worsened for 57 cities across Europe, the highest number since the Great Financial Crisis.
Polarization between London and UK regional cities also continued to widen in this year’s index.
Conversely, German cities proved to be less volatile in economic crisis and complementary of each other, with four German cities making it into the index’s top 20.
More broadly, since the ECGI’s inception in 2000, only London, Paris and Munich have consistently ranked in the top 10. Moreover, Amsterdam’s inclusion in the list this year comes due to the city’s human capital and employment growth prospects which remain exceptionally strong.
The last day of summer in the Northern Hemisphere was September 22nd, and cooler temperatures will surely be welcomed by many. Europe and China recorded their hottest-ever summers since recordkeeping began in 1880, according to NOAA’s National Centers for Environmental Information. Meanwhile, the US recorded its third-hottest summer by the same metric.
The summer has also been a reminder to consider both the physical and transition risks associated with climate change. Reducing carbon emissions, which is key to preventing further long-term escalation in events such as these, has come under renewed urgency given recent geopolitical tensions.
Economic impacts extended across the world. Transport throughout the UK ground to a halt for part of July as temperatures reached levels never imagined by the Victorian engineers who designed its railway network. A lack of rainfall left crops parched and caused key rivers such as the Rhine to reach levels so shallow that they were not navigable by the barges that have become a key part of Central Europe’s supply chains. In some areas of the US, the key problem was too much precipitation, with extreme rain causing severe disruption in Kentucky and Saint Louis; flooding contributed to a drinking water crisis in Jackson, Mississippi. In China, precipitation in Jiangxi and Anhui provinces in July and August was 60% less than a year ago. Record heat and drought across China, including parts of the Yangtze River, caused a shortage of hydro-power and halted shipping. Relief from this year’s extreme temperatures is coming at the same time as what looks to be another severe season for hurricanes and wildfires takes shape. Hurricane Fiona left all of Puerto Rico without power before making a rare assault on Canada’s maritime provinces, and Hurricane Ian is likely to be the worst hurricane to hit the west coast of Florida since 1921.
The summer has also been a reminder to consider both the physical and transition risks associated with climate change. Reducing carbon emissions, which is key to preventing further long-term escalation in events such as these, has come under renewed urgency given recent geopolitical tensions. Most European countries face a severe energy crisis triggered by Russia’s war in Ukraine and the cessation of natural gas flows through key pipelines. Renewables like solar power have the dual benefit of aiding decarbonization and reducing dependence on Russian fossil fuels.
As real estate investors, we are concerned about the impacts that climate change will have on our investments. On the physical risk side, it is critical that we become aware of the extent to which climate risk hazards may directly impact our portfolios and prepare our buildings to be resilient to climate change. The first step is to identify the physical climate hazards that will impact specific buildings, measure the exposure to those hazards in aggregate within the portfolio, and then get to work managing, mitigating, and strategizing around these risks.
To get the data, we have a plethora of climate data providers and forecasters to choose from, but it can be overwhelming to narrow the field down. When we reviewed multiple data providers, we found considerable inconsistency in how metrics are defined, and wide variation in risk scores for the same hazard at the same property.
Our recent report, “How to Choose, Use and Better Understand Climate Risk Analytics”, researched and written in partnership with the Urban Land Institute (ULI), is an excellent overview of the challenges faced by first-time consumers of climate data. The paper outlines physical climate risk basics, identifies differences between data providers to be aware of, and raises a call to action to standardize the outputs in ways that are most meaningful and useful for real estate, with transparency that enables apples‑to‑apples comparisons across models.
Once the data is in hand, the next step is to manage the risks at two levels: at the property level, through evaluating both existing and potential new hardening strategies to be more resilient against particular hazards; and at the portfolio level, through assessment of exposure concentrations and consideration of how climate risk informs overall portfolio construction strategies. And lastly, we must continue to monitor these risks on a regular basis, because one thing we know for sure is that our climate will continue to change, and more disruptive and damaging seasons like the hot summer of 2022 are likely to recur.
A new report from the Urban Land Institute (ULI) and LaSalle Investment Management (LaSalle), a leading real estate investment management firm, outlines steps that real estate practitioners can take to better manage climate risk in their portfolios and suggests ways in which climate risk providers can better serve the real estate industry.
Based on the insights of real estate managers and climate data providers across the globe, How to Choose, Use, and Better Understand Climate-Risk Analyticscomes as real estate investors are recognizing the need to incorporate the physical risks associated with climate change – including wildfires, hurricanes, and excessive heat – into their business models. Accordingly, having reliable data and analytics tools to assist in this process is becoming an increasingly important consideration.
“Over the past few years, climate analytics tools have transformed how investors can assess, price, and mitigate climate risk,” said Billy Grayson, Executive Vice President for Centers and Initiatives at ULI. “As with all new tools, it will take some time for real estate developers and investors to identify the best ways to apply these tools to real estate decision-making. Learning from the successes and challenges of early adopters will help the real estate community as a whole, and we hope this report can serve as a roadmap for those looking to better leverage these tools to manage climate risk in their assets and portfolios.”
“Dealing with climate risk is a collective effort – we all benefit from consistency and transparency,” said LaSalle’s Americas Head of Sustainability Elena Alschuler. “Alignment on key terms and methodologies is critical to the industry’s effort to assess and address climate risk, which should ultimately benefit investors through improved returns.”
How to Choose, Use, and Better Understand Climate-Risk Analytics provides a climate assessment roadmap for practitioners seeking to optimize their risk-mitigation practices. The roadmap will help the real estate industry:
Assess key areas of variation among climate risk providers in terms of the strength of their approach and ability to meet strategic objectives, such as business needs and regulatory compliance.
Interpret physical climate risk results including value-at-risk, or the potential financial impact of a property experiencing climate-related damage.
Integrate risk-assessment strategy with acquisition, development, financial reporting, and asset and portfolio management teams.
Additionally, the report provides four key takeaways on the state of climate risk assessment in real estate:
Current risk metrics are inconsistent. Often, different climate risk analytics produce widely disparate risk scores for the same property, sometimes by orders of magnitude.
Bridging the science-business gap. Translating the complexity of climate science into applied real estate industry practices is still in its early stages, with firms trying different approaches to integrating climate risk across investment, asset management, and disposition strategies.
Rapid acceleration of market value impacts. While the impact of climate risk on current asset prices is not yet apparent in the market, institutional real estate managers are starting to incorporate it, therefore many believe the impacts will become increasingly visible.
Transparency is key. Improved understanding and increased public discourse on physical risk in pricing will push the industry closer to uniform practice and standards.
“Investors today face numerous challenges factoring climate risk into their portfolios,” said Lindsay Brugger, Vice President of Resilience at ULI. “The industry lacks clear guidance around how climate risk data providers should be selected and how to integrate that information into business strategy. This report provides a series of guidelines so real estate practitioners can simultaneously mitigate the effects of climate change while remaining competitive in a rapidly evolving marketplace.”
“We strongly believe that the impacts of climate risk are material to our investment performance, and need to be proactively taken into consideration to ensure our investments are prepared for future risks, legislation and client demand,” said Brian Klinksiek, LaSalle Head of European Research & Global Portfolio Strategies. “While there is still uncertainty in the market around data transparency, which tools to use and what policy impacts might be, one thing remains clear: now is the time to be having these conversations and taking action.”
About LaSalle Investment Management LaSalle Investment Management is one of the world’s leading real estate investment managers. On a global basis, we manage approximately $82 billion of assets in private equity, debt and public real estate investments as of Q2 2022. The firm sponsors a complete range of investment vehicles including open- and closed-end funds, separate accounts and indirect investments. Our diverse client base includes public and private pension funds, insurance companies, governments, corporations, endowments and private individuals from across the globe. For more information please visit www.lasalle.com and LinkedIn.
NOTE: This information discussed above is based on the market analysis and expectations of LaSalle and should not be relied upon by the reader as research or investment advice regarding LaSalle funds or any issuer or security in particular. The information presented herein is for illustrative and educational purposes and is not a recommendation, offer or solicitation to buy or sell any securities or to adopt any investment strategy in any jurisdiction where prohibited by law or where contrary to local law or regulation. Any such offer to invest, if made, will only be made to certain qualified investors by means of a private placement memorandum or applicable offering document and in accordance with applicable laws and regulations. Past performance is not indicative of future results, nor should any statements herein be construed as a prediction or guarantee of future results.
Company news
Jun 18, 2025 LaSalle acquires Ruby Stella Hotel in Clerkenwell
The five-building industrial complex was acquired on behalf of the LaSalle Property Fund.
Feb 11, 2025 Kunihiko Okumura and Steve Hyung Kim appointed Asia Pacific leaders
Keith Fujii to assume the role of Chairman of Asia Pacific, with all changes to be effective July 1, 2025.
Make sure you’ve spelled everything correctly, or try searching for something else. If you still can’t find what you’re looking for, you can always Contact us to talk to someone.
The start of the grape harvest season calls to mind the similarities between winemaking and real estate. Real estate fund managers often borrow vineyard terminology to describe their actions. Seed capital is raised and invested, portfolios are pruned, proceeds are harvested, and funds are classified by their vintage year, meaning the year of fund formation.
Does the inception year for a fund matter in the same way a vintage year matters for wine? Our analysis of data from Preqin highlights that both the vintage year and risk style of a fund have been important determinants of performance over the last 30 year.
Does the inception year for a fund matter in the same way a vintage year matters for wine? Our analysis of data from Preqin highlights that both the vintage year and risk style of a fund have been important determinants of performance over the last 30 years (Page 5).
A wine vintage is shaped by external conditions like the weather. Stressful conditions like droughts can produce great wine. Likewise, macroeconomic conditions influence a fund’s risk and return characteristics. In the Mid-Year 2022 ISA, we noted how capital markets are experiencing a major regime shift. The macroeconomic environment has quickly moved from lower-for-longer to weaker growth (Page 33), high inflation (Page 14), and higher interest rates (Page 9), all of which affect real estate performance.
Vintage years characterized by major disruptions in macroeconomic conditions – like the dot-com crash or the global financial crisis – have been associated with modestly higher median returns compared to the prior period, but also a significantly higher dispersion of returns (Page 6). So, a stressful macro environment simultaneously creates higher volatility while it also slightly raises the odds of a stronger entry point for investing. Put differently, choosing a wine from a good vintage year is no guarantee that it will turn out to be a memorable bottle!
In wine-growing countries across the world, the summer has been dry and hot. Decades of historic data allow oenologists to draw inferences about the likely quality of the 2022 wine vintage. However, vintage year analysis for real estate funds is trickier. For one thing, the combination of macroeconomic conditions that the 2022 real estate fund vintage faces–weak growth, high inflation and rising interest rates–have not been seen in conjunction since the 1970s.
In addition, the repricing implied by public real estate markets (page 31) has not yet fully worked its way through private markets. On the one hand, capital that has been invested early in 2022 already might face valuation declines if the repricing continues. On the other hand, any private equity repricing in late 2022 offers an interesting entry point for funds with dry powder.
Even with plenty of data to review, it takes the passage of time to confirm the final quality of a wine vintage. We also expect that it will take several years for the true quality of the 2022 real estate fund vintage to be known. Nevertheless, the wine analogy (and our own research) shows that stress can still produce a strong vintage, for wine or for real estate.
LaSalle Investment Management (“LaSalle”) has announced a series of additions and enhancements to its European Research & Strategy leadership team, reflecting a deepened focus on its key investor products and an emphasis on driving competitive investment performance.
Dan Mahoney succeeds LaSalle’s newly appointed Global Head of Research & Strategy, Brian Klinksiek, as Head of European Research & Strategy, effective 1 January 2023. He brings over 14 years’ experience as a strategist in the firm’s North America Research & Strategy team, where he helped drive investment performance through a range of successful initiatives, including a focus on LaSalle’s US residential strategies. During that time, he acted as the Research & Strategy team’s chief liaison for several clients and funds. In his new role, Dan will relocate to London and focus on further embedding and enhancing the use of proprietary, risk-adjusted frameworks and analytics to drive investment conviction across debt and equity strategies in Europe. He will report to both Brian Klinksiek and Philip La Pierre, Head of Europe.
As part of this restructuring, Petra Blazkova has been appointed to the newly created role of Head of Research & Strategy, Core & Core-Plus Capital, Europe. Previously Managing Director within LaSalle’s European Research & Strategy team, Petra was responsible for overseeing Continental European market analysis from the London office. In her new capacity, she will relocate to Munich and work closely with David Ironside, fund manager of Encore+, and Uwe Rempis, fund manager of LaSalle E-REGI, as well as the firm’s separate accounts, supporting the funds’ ongoing strategies and development.
Completing these changes, Dominic Silman has been appointed as Head of Research & Strategy, Debt & Value-Add Capital, Europe. Previously Senior Strategist within LaSalle’s European Research & Strategy team, Dominic will continue to be based in the London office and will work directly with Michael Zerda, Head of Debt & Value-Add Strategies, on the firm’s European debt strategies and recently reconstituted value-add platform. In their new roles, Petra and Dominic will report into Dan Mahoney.
Brian Klinksiek, incoming Global Head of Research & Strategy at LaSalle Investment Management, said: “The breadth and depth of our European Research & Strategy team enables LaSalle to drive forward its best-in-class client offering across Europe. These appointments will help maintain that momentum, underpinning our growing and integrated product mix, and ensuring the ongoing success of LaSalle’s commingled funds and separate accounts. I look forward to continuing to work with Dan, Petra and Dom as the European Research & Strategy team goes from strength to strength”.
Philip La Pierre, Head of Europe at LaSalle Investment Management, added: “Dan, Petra and Dom’s collective experience will be key to our in-house market-leading intelligence and the delivery of competitive investment performance across the full spectrum of our products. They will play a vital role in informing investment decisions and portfolio construction, particularly as we continue to diversify our asset allocation, grow our value-add strategies and build upon our well-established debt series.”
About LaSalle Investment Management
LaSalle Investment Management is one of the world’s leading real estate investment managers. On a global basis, we manage approximately $82 billion of assets in private equity, debt and public real estate investments as of Q2 2022. The firm sponsors a complete range of investment vehicles including open- and closed-end funds, separate accounts and indirect investments. Our diverse client base includes public and private pension funds, insurance companies, governments, corporations, endowments and private individuals from across the globe. For more information please visit www.lasalle.com, and LinkedIn.
NOTE: This information discussed above is based on the market analysis and expectations of LaSalle and should not be relied upon by the reader as research or investment advice regarding LaSalle funds or any issuer or security in particular. The information presented herein is for illustrative and educational purposes and is not a recommendation, offer or solicitation to buy or sell any securities or to adopt any investment strategy in any jurisdiction where prohibited by law or where contrary to local law or regulation. Any such offer to invest, if made, will only be made to certain qualified investors by means of a private placement memorandum or applicable offering document and in accordance with applicable laws and regulations. Past performance is not indicative of future results, nor should any statements herein be construed as a prediction or guarantee of future results.
Company news
Jun 18, 2025 LaSalle acquires Ruby Stella Hotel in Clerkenwell
The five-building industrial complex was acquired on behalf of the LaSalle Property Fund.
Feb 11, 2025 Kunihiko Okumura and Steve Hyung Kim appointed Asia Pacific leaders
Keith Fujii to assume the role of Chairman of Asia Pacific, with all changes to be effective July 1, 2025.
Make sure you’ve spelled everything correctly, or try searching for something else. If you still can’t find what you’re looking for, you can always Contact us to talk to someone.
Heightened geopolitical risk, persistent high inflation, and a possible recession will place European real estate under acute pressure in H2 2022. However, the asset class is expected to continue to provide longer-term stability for core investors via carefully curated portfolios, as well as offering new opportunity for investors seeking value-add returns – according to the mid-year 2022 edition of the Investment Strategy Annual (“ISA”), the report published by global real estate investment manager LaSalle Investment Management (“LaSalle”).
Europe is facing a macroeconomic environment rendered fragile by supply chain issues, a hot war on the region’s periphery and a squeeze on consumers’ disposable incomes. As a result, LaSalle expects real estate investors to adopt a much more cautious approach in the second half of 2022. However, while inflationary pressures have surged, and interest rates have increased earlier and more quickly than expected, real estate assets can act as a hedge against inflation in cases where landlords have pricing power. Fundamentally, this will manifest for investors with the best assets in the right locations, where supply-demand imbalances underpin rental growth.
Furthermore, in an uncertain environment, investors seeking higher returns can expect to benefit from dislocation and opportunities to repurpose assets. Off-market or value-add opportunities could potentially offset the effect of rising operating expenses, construction costs and interest rates, either through building-specific renovation or repositioning to achieve occupancy improvement or rental uplift.
Long-term resilience will be underpinned by careful stock selection. Although European real estate markets have been impacted by global headwinds, pockets of opportunity persist for investors across each sector.
Retail rebound postponed
In retail, the post-Covid recovery has been shaken by the impact of inflation on consumer discretionary spending power. Bricks-and-mortar retail warehouses have, however, remained resilient due to the non-discretionary nature of underlying demand for grocery anchors and their convenience offer. But fundamental challenges for European shopping centres and high-street retail is expected to persist, despite destination shopping continuing to remain an integral part of the retail experience in the long term. We remain optimistic on the outlook for outlet centres, which are set to benefit from increasing consumer frugality.
Office sector ‘trifurcation’
As with retail, the office sector is experiencing occupier and investor needs varying greatly by the quality of asset and micro location. Experientially rich buildings in prime locations that meet sustainability standards and benefit from high-quality amenities will continue to attract demand. In addition, with the pathway to Net Zero Carbon in mind, the age and quality of existing stock in European markets presents an opportunity to create the offices of the future, particularly through refurbishment. However, there is a growing range of older stock which is likely to be stranded and should be sold at – or at times even below – current valuation before liquidity dries up.
Logistics demand story remains intact
Logistics has not been immune to recent market shocks and the ongoing cost-of-living crisis. A slowdown in take-up by major occupiers marks a change from many years of continued expansion. However, LaSalle believes that the sector remains in a robust position to grow in the coming months. European logistics properties recorded the highest demand for new space ever in H1 2022, driven by continuous e-commerce expansion, as well as just-in-case inventories and the nearshoring of some manufacturing activity. As a result, vacancy rates are at historical lows, and we remain confident of future prospects for European logistics rental growth.
Living strategies’ prospects at risk of divergence
The living sectors remain underpinneD by strong demand drivers including robust household formation, growth in key cities, an ageing population, increasing mobility and a structural undersupply across Europe. However, potential home buyers may tilt toward renting, owing to the rising cost of debt. For the more niche living sub-sectors, such as student housing and senior housing, investors will need to be ahead of the curve to take advantage of attractive pricing.
Finding value across the yield spectrum
With the European landscape evolving quickly, assessing the prospect for various sectors requires consideration of assets’ pricing yield levels and income growth potential.
LaSalle’s framework finds that for low-yield sectors with excellent fundamentals, like logistics, prime low-carbon offices in key cities and unregulated residential, valuations will hinge on the potential for and relative magnitude of future rental growth and an upward shift in yields. In low-yielding sectors where inflation cannot be offset by rental growth, caution must be exercised until markets stabilise.
Although higher-yielding sectors with challenged fundamentals are intuitively those in which value may be identifiable, recent concerns around economic growth have made their impact felt. The nascent retail recovery, for instance, is at risk from inflationary pressure on real incomes, while capex-intensive strategies to renovate buildings are affected by rising construction costs. Meanwhile, sectors with relatively higher yields and stronger net operating income growth potential – namely alternative living sectors, such as student accommodation or senior living – continue to remain attractive.
Brian Klinksiek, Head of European Research and Global Portfolio Strategies at LaSalle, said: “The past six months have seen macroeconomic headwinds and geopolitical risk affect the global economic outlook. European investors should therefore exercise caution in the coming months until market valuations and asset pricing stabilise. But despite this, real estate will remain an anchor as other asset classes struggle, and investors look for predictability. Underpinned by the long-term resilience of the asset class, careful portfolio construction across the key sectors of European real estate can continue to deliver the benefits of diversification, stability and long-term income growth for investors.”
Jacques Gordon, Global Head of Research and Strategy at LaSalle, added: “Real estate generally provided shelter during the waves of volatility that swept through the securities markets in the first half of the year. In the second half, we foresee different dynamics unfolding. The big change has been the sharp rise in inflation in Western countries and a “regime shift” from highly accommodative to tightening monetary policies by several central banks. Many world events simultaneously contributed to this inflection point including: the re-opening of economies after COVID-19, Russia’s invasion of Ukraine, trade wars, and government stimulus spending. Although these pressures were building in 2021, there is no escaping the fact that the financial and commodity markets shifted sharply in the first half of 2022. Our guidance for investors to seek inflation protection in real estate is a focus-theme of our mid-year update.”
About LaSalle Investment Management LaSalle Investment Management is one of the world’s leading real estate investment managers. On a global basis, we manage approximately $82 billion of assets in private equity, debt and public real estate investments as of Q2 2022. The firm sponsors a complete range of investment vehicles including open- and closed-end funds, separate accounts and indirect investments. Our diverse client base includes public and private pension funds, insurance companies, governments, corporations, endowments and private individuals from across the globe. For more information please visit www.lasalle.com and LinkedIn.
NOTE: This information discussed above is based on the market analysis and expectations of LaSalle and should not be relied upon by the reader as research or investment advice regarding LaSalle funds or any issuer or security in particular. The information presented herein is for illustrative and educational purposes and is not a recommendation, offer or solicitation to buy or sell any securities or to adopt any investment strategy in any jurisdiction where prohibited by law or where contrary to local law or regulation. Any such offer to invest, if made, will only be made to certain qualified investors by means of a private placement memorandum or applicable offering document and in accordance with applicable laws and regulations. Past performance is not indicative of future results, nor should any statements herein be construed as a prediction or guarantee of future results.
Company news
Jun 18, 2025 LaSalle acquires Ruby Stella Hotel in Clerkenwell
The five-building industrial complex was acquired on behalf of the LaSalle Property Fund.
Feb 11, 2025 Kunihiko Okumura and Steve Hyung Kim appointed Asia Pacific leaders
Keith Fujii to assume the role of Chairman of Asia Pacific, with all changes to be effective July 1, 2025.
Make sure you’ve spelled everything correctly, or try searching for something else. If you still can’t find what you’re looking for, you can always Contact us to talk to someone.
An unrelenting wave of macro news amidst record-breaking heat has carried through all of 2022 to the start of August. With persistent high inflation readings (p.13), energy price volatility and supply disruption (p. 20), interest rate hikes (p. 4), bear equity markets (p. 8), heightened recession risk (p. 3), and VC capital slowing (p. 7) – the post-COVID recovery cycle is at risk.
Recently published books that we’re reading – and recommending – this summer delve into energy geopolitics, climate change impacts, and the history of real estate and investments.
Yet August, with its summer festivals and family holidays for many, is a good month to put the frenetic pace of change into perspective. Many of the indices, prices, and events summarized in our macro indicators deck reveal just the tip of the iceberg, with a deeper, complex story hidden from view. Often only a longer form, like a book, can do justice to these stories.
Recently published books that we’re reading – and recommending – this summer delve into energy geopolitics, climate change impacts, and the history of real estate and investments. Helen Thompson’s Disorder: Hard Times in the 21st Century (Feb. 2022) traces how historic energy policy contributed to today’s geopolitical fractures, in Europe and beyond.In asimilar vein, Ian Bremmer’s Power of Crisis (May 2022) looks at how leaders are responding to three big crises facing the world: health emergencies, climate change, and the rise of artificial intelligence (AI). The UK, Central China, and Texas have sweltered through record temperatures over the last month and the continued backdrop of virulent COVID strains, like BA.5, continue to show how these crises are not mere abstractions but are a recurring part of modern life.
Concrete examples of climate impacts, like how reptiles are trying to cope with more frequent Caribbean storms, abound in Thor Hanson’s excellent book, Hurricane Lizards and Plastic Squid (Sept. 2021). Hansen delves into a new field of climate change biology. He describes the long sweep of natural time as one of “punctuated equilibrium.” This consists of “bursts of rapid activity (punctuations) followed by long periods of stability.” This pattern also aptly describes economic and real estate cycles, with current turmoil upsetting the post-GFC equilibrium.
Turning to real estate – and some quite recent history – The Cult of We (July 2021) by Eliot Brown and Maureen Farrell – lifts the curtain on the madcap history of WeWork’s founding by Adam Neumann. The writers focus on the hubris that led to the downfall of “We”, although the recent reset and rebound of many shared office concepts is beyond their scope. Alexandra Lange’s Meet Me by the Fountain focuses on the shopping mall – and how it “has changed and changed again” from futuristic, to ubiquitous, to pandemic-induced redevelopments (June 2022). In Land (Jan. 2021), Simon Winchester links a variety of tales on a theme of land as “the only thing on earth that lasts.”
And, in a book tailored for investors, InPursuit of the Perfect Portfolio (Aug. 2021), Lo and Foerster describe how the ideas of Markowitz, Bogle, Shiller, Siegel, and six other investment visionaries developed the frameworks that have taught us to build better portfolios.
We also invite you to read our Mid-Year ISA, released last month, laying out our global real estate investment recommendations at this inflection point, with a particular focus on inflation protection, strategies to weather shifting monetary policy, and the sustainability revolution in real estate. In addition, we have published a new white paper this month on the Demographics of Aging and its impact on real estate.
Market direction and economic outlooks have shifted since the start of 2022, with elevated inflation, slowing economic growth, and higher interest rates impacting the real estate market. According to LaSalle’s 2022 Mid-Year Investment Strategy Annual (“ISA”), the overall market shifts are causing real estate investors to re-visit earlier strategies as they understand and react to higher inflation, the Fed’s and the Bank of Canada’s rapid interest rate increases to combat it, and global geopolitical and economic upheaval.
In North America, the impacts of inflation and rising rates on real estate are nuanced, and require an understanding of each sector’s fundamentals, which the report explores. Coming into 2022, LaSalle Research & Strategy noted that the pandemic and its ensuing economic ripple effects had accelerated pre-pandemic trends, widening the gap between favored and non-favored property types. The mid-year report shows these trends are continuing as investors gravitate to favored property types with strong underlying fundamentals. Looking ahead, there is uncertainty in the market, but it appears as though the favored property types are well-positioned to withstand a potential economic slowdown.
Jacques Gordon, Global Head of Research and Strategy at LaSalle, said: “Real estate generally provided shelter during the waves of volatility that swept through the securities markets in the first half of the year. In the second half, we foresee different dynamics unfolding. The big change has been the sharp rise in inflation in Western countries and a “regime shift” from highly accommodative to tightening monetary policies by several central banks. Many world events simultaneously contributed to this inflection point including: the re-opening of economies after COVID-19, Russia’s invasion of Ukraine, trade wars, and government stimulus spending. Although these pressures were building in 2021, there is no escaping the fact that the financial and commodity markets shifted sharply in the first half of 2022. Our guidance for investors to seek inflation protection in real estate is a focus-theme of our mid-year update.”
Select 2022 Mid-Year ISA findings for North America include:
In line with the full-year ISA’s prediction, favored property types including industrial, multifamily, medical office and single family rentals continue to have strong fundamentals and outperform on a relative basis. Industrial development and transactions continue as there remains a supply gap and businesses who lease these spaces continue to show they can continue to pay rents, even as they increase. The residential property types also have a strong outlook. As interest rates rise and inflation impacts housing starts, many would-be homebuyers may look to rent.
The debt markets remain liquid, providing the capital needed to finance transactions. While the Mid-Year ISA expects a slowdown in transactions, debt funds, life insurance companies and banks continue to lend to strong, established sponsors. Meanwhile, CMBS issuance has slowed, and higher interest rates mean highly leveraged borrowers are less competitive bidders for property. For borrowers, leverage is less accretive than last year, but many are still using leverage with the belief that future income growth will make leverage accretive to returns over their hold period.
The report also looks at capital flows as barometer of market health, and notes that NAV REITs continue to raise capital, as retail investors start to establish a portfolio allocation to real estate and diversify amid a volatile market environment. While many closed-end funds still have dry powder from previous capital raises, new institutional capital raises appear to have slowed slightly as established investors have reached their target allocations after playing catchup over the last several years.
Transaction volume in the first quarter of the year was higher than the first quarter of the prior year. US transaction volume last quarter was $157.6 billion, 76 percent higher than a year ago. In Canada, USD $10.7 billion traded in last quarter, representing a 71 percent year-over-year increase. The report estimates that pricing has adjusted downward from a peak in the first quarter of 2022 by a range of 0-15 percent depending on market segment, giving back a portion of the gains from the last 12 months. Though second quarter data is not yet available, anecdotally it seems transactions have slowed amidst shifting pricing and broader uncertainty. However, a bid-ask gap has not developed as buyers and sellers have been willing to accept similar price declines.
Rich Kleinman, Americas Co-CIO and Head of US Research & Strategy at LaSalle, said, “While it remains to be seen how inflation and interest rates will evolve in the second half of the year, it is our view that many property types are well-positioned to support investor goals in the months ahead, and that real estate exposure should play a productive role in investors’ portfolios. Experience in recent downturns is also helping investors and lenders navigate the uncertainty, which should bode well for the industry as a whole.”
Chris Langstaff, Head of Research and Strategy for Canada at LaSalle, said, “Canada is historically a stable market, and it appears that while many of the same headwinds apply, fundamentals remain strong and transactions in many property types are moving forward.”
About LaSalle Investment Management LaSalle Investment Management is one of the world’s leading real estate investment managers. On a global basis, we manage approximately $82 billion of assets in private equity, debt and public real estate investments as of Q2 2022. The firm sponsors a complete range of investment vehicles including open- and closed-end funds, separate accounts and indirect investments. Our diverse client base includes public and private pension funds, insurance companies, governments, corporations, endowments and private individuals from across the globe. For more information please visit www.lasalle.com and LinkedIn.
NOTE: This information discussed above is based on the market analysis and expectations of LaSalle and should not be relied upon by the reader as research or investment advice regarding LaSalle funds or any issuer or security in particular. The information presented herein is for illustrative and educational purposes and is not a recommendation, offer or solicitation to buy or sell any securities or to adopt any investment strategy in any jurisdiction where prohibited by law or where contrary to local law or regulation. Any such offer to invest, if made, will only be made to certain qualified investors by means of a private placement memorandum or applicable offering document and in accordance with applicable laws and regulations. Past performance is not indicative of future results, nor should any statements herein be construed as a prediction or guarantee of future results.
Company news
Jun 18, 2025 LaSalle acquires Ruby Stella Hotel in Clerkenwell
The five-building industrial complex was acquired on behalf of the LaSalle Property Fund.
Feb 11, 2025 Kunihiko Okumura and Steve Hyung Kim appointed Asia Pacific leaders
Keith Fujii to assume the role of Chairman of Asia Pacific, with all changes to be effective July 1, 2025.
Make sure you’ve spelled everything correctly, or try searching for something else. If you still can’t find what you’re looking for, you can always Contact us to talk to someone.
LaSalle Investment Management (“LaSalle”) today announced that after 28 years of distinguished service and leadership of the Research & Strategy group at the firm, Jacques Gordon has confirmed he will retire from the business at the end of 2022 in to order pursue interests in higher education. He will remain as the Global Head of Research & Strategy through the remainder of this year, and will be succeeded by Brian Klinksiek, LaSalle’s current Head of European Research & Global Portfolio Strategies, effective 1 January 2023.
Brian will continue to be based in London and will join LaSalle’s Global Management committee, reporting to CEO Mark Gabbay. Succession for Brian’s Head of European Research & Strategy role is in process and will be announced prior to his transition to global leadership in 2023.
LaSalle Global CEO Mark Gabbay said, “This transition reflects LaSalle’s continued focus on thoughtful leadership succession, offering both continuity along with fresh ideas to be infused across the organization. We are grateful for the numerous contributions Jacques has provided LaSalle and the broader industry over the course of his career, and look forward to recognizing these accomplishments in the months ahead. Brian’s professional experience positions him well to take on this role, having lived, worked, and covered the real estate markets in North America, Europe and Asia-Pacific.”
After joining LaSalle in 2020, Brian led the reorganization of LaSalle’s European Research & Strategy team from a geography-focused model to a more dynamic pan-European sector-focused model. He has deepened the Research & Strategy team’s integration within the firm’s newly formed European Debt & Value-add platform, and also led the creation of LaSalle’s global investment risk management function. Brian has been a leading industry advocate for the incorporation of climate risk analysis into investment-making decisions, and is a champion for diversity in the workplace, having been appointed Chair of LaSalle’s European Culture of Care committee in 2021.
Brian Klinksiek, incoming Global Head of Research & Strategy said, “It is an honor to be named the next leader of LaSalle’s world-class Research & Strategy team. Jacques has done a remarkable job establishing LaSalle’s reputation for timely insights, accurate forecasts, and impactful strategy that is fully integrated with the investment process. He has been a role model for me throughout my career – even before I joined the firm. I am thankful for his guidance and partnership, and look forward to continuing to seek his counsel as he moves into academia.”
Jacques Gordon, retiring Global Head of Research & Strategy said, “I am grateful for the experiences, insights and friendships I’ve gained during my time at LaSalle. Our Global Research & Strategy team is well-positioned to continue to deliver great value to our clients and investment colleagues around the world, and Brian is the right leader to drive the next phase of innovation and growth. I look forward to seeing the firm prosper as I transition to the next chapter of my career.”
About LaSalle Investment Management LaSalle Investment Management is one of the world’s leading real estate investment managers. On a global basis, we manage approximately $82 billion of assets in private equity, debt and public real estate investments as of Q2 2022. The firm sponsors a complete range of investment vehicles including open- and closed-end funds, separate accounts and indirect investments. Our diverse client base includes public and private pension funds, insurance companies, governments, corporations, endowments and private individuals from across the globe. For more information please visit www.lasalle.com and LinkedIn.
NOTE: This information discussed above is based on the market analysis and expectations of LaSalle and should not be relied upon by the reader as research or investment advice regarding LaSalle funds or any issuer or security in particular. The information presented herein is for illustrative and educational purposes and is not a recommendation, offer or solicitation to buy or sell any securities or to adopt any investment strategy in any jurisdiction where prohibited by law or where contrary to local law or regulation. Any such offer to invest, if made, will only be made to certain qualified investors by means of a private placement memorandum or applicable offering document and in accordance with applicable laws and regulations. Past performance is not indicative of future results, nor should any statements herein be construed as a prediction or guarantee of future results.
Company news
Jun 18, 2025 LaSalle acquires Ruby Stella Hotel in Clerkenwell
The five-building industrial complex was acquired on behalf of the LaSalle Property Fund.
Feb 11, 2025 Kunihiko Okumura and Steve Hyung Kim appointed Asia Pacific leaders
Keith Fujii to assume the role of Chairman of Asia Pacific, with all changes to be effective July 1, 2025.
Make sure you’ve spelled everything correctly, or try searching for something else. If you still can’t find what you’re looking for, you can always Contact us to talk to someone.
More economic and geopolitical history unfolded in the first half of 2022 than typically occurs during the span of several “normal” years. The quaint concept of “normality” may itself prove to be an artifact of history. Yet, the mid-year ISA describes how real estate held up well despite all the tumult. Strategies we set out in 2021, performed as expected, or sometimes even better than expected. Strategy shifts recommended by LaSalle for the second half of the year are modest, despite a renewed focus on the changing macro environment.
Real estate generally provided shelter during the waves of volatility that swept through the securities markets in the first half of the year. In the second half, we foresee different dynamics unfolding as described in Chapter 1, and in the specific strategy shifts recommended in Chapter 2. The big change has been the end of ultra-low interest rates in Western countries. Finally, we revisit the role of real estate in a portfolio in Chapter 3, based on new research done with JLL for the bi-annual Transparency Index, as well as the most recent updates to the correlations with other asset classes.
The most important change in the macroeconomic outlook has been the regime shift from highly accommodative to tightening monetary policies by Western central banks. Many world events simultaneously contributed to this inflection point including: the re-opening of economies after COVID-19, Russia’s invasion of Ukraine, trade wars, and government stimulus spending. Although these pressures were building in 2021, there is no escaping the fact that the financial and commodity markets shifted sharply in the first half of 2022.
In this mid-year update, we focus on the ways that assets and portfolios can be positioned to weather a sustained period of high inflation. We acknowledge that each country is in a slightly different position in the transition from low to higher inflation and that each central bank will react differently to the mix of cost-push and demand-pull inflationary forces.
Other highlighted trends include the continuing competition and complementarity between virtual and physical space. Patterns that affect both asset and sector selection are now coming more clearly into view. Also, we point to the continued momentum of the sustainability revolution as investment managers commit to reducing the carbon footprint of their portfolios, while also grappling with climate risk forecast challenges, transition risks from new regulations, and social issues like housing affordability or health and well-being factors that affect tenants.
Thanks for your submission. This report has been expertly crafted with insights
gleaned from the knowledge and expertise provided by LaSalle Investment Management’s
research team.
Stellar private real estate returns continue; but poised to decelerate
US private real estate returns remained very strong in the first quarter of 2022, which brought trailing-year returns to levels not seen in 40 years. Industrial and apartment sectors continued to lead, while office and retail continued to lag. The 1Q returns do not reflect the rapid changes in the US macro-economic environment that started in the first half of 2022. It is almost certain returns will slow dramatically in the coming quarters, but the timing and magnitude of the shift to lower returns is highly uncertain.
This note provides some details on the performance of the NPI and ODCE indices, along with views on the outlook for US private real estate returns informed by LaSalle’s market activity, valuations, and the PREA Consensus forecast.
Highlights from the 1Q data releases include:
Quarterly total returns appear to have peaked at the end of 2021. The NPI total return of 5.3% in the first quarter was down from 6.1% in the fourth quarter, but still the third consecutive quarter with a quarterly return over 5%. The trailing-year return is up to 21.9%, the highest since the first quarter of 1980 (another time when inflation was elevated).
The quarterly income return of 0.99% was below 1% for the first time ever, bringing the trailing-year income return to 4.18%. Appreciation returns of 4.34% brought the trailing-year appreciation to 17.2%, the highest in the history of the NPI (dating to 1978).
Property type trends remained consistent with past quarters, with industrial leading by a wide margin, apartments also delivering strong performance, while office and retail lagged significantly. This continues to highlight the importance of sector selection in driving relative performance.
The ODCE quarterly gross total return of 7.37% was down 60 bps from the record level in the fourth quarter. This was comprised of a 0.93%income return and a 6.44% appreciation return. The trailing-year gross ODCE return is up to 28.5%; 27.3% on a net basis, both all-time highs.
1Q returns are based on income earned in the first quarter and appraisals completed over the course of the quarter. These returns do not reflect the negative macro news that started to emerge in the first half of 2022.
The transition from acute to chronic stress
Three months after the Russian invasion of the Ukraine, the fighting and destruction continues. Our March macro deck focused on the ensuing volatility of equity markets, consumer prices and energy costs. In June, there is no sign of the conflict abating, volatility in the capital markets remains high, and energy costs continue to edge upward. As the situation in Ukraine transforms from an acute conflict into a chronic state of affairs, it joins a string of other global stress points that remain ongoing and without closure. Among them are: COVID-19, rising inflation, supply-chain blockages, climate change, and geo-political tensions that exist far beyond Eastern Europe.
The progression from acute to chronic has another positive aspect. The transition allows investors to underwrite assets with the new risks accounted for.
The trade links between the world and the conflict zone in Ukraine are relatively small in aggregate terms. However, when combined with COVID-related snags and new sanctions on Russian exports, these blockages become severe all across Europe and beyond. Critical commodities such as energy, grains, and specific materials with direct implications for real estate (such as sheet metal and sprinklers used in warehouse buildings) are all affected. This contributes to higher levels of inflation in Europe and around the world. The macro deck shows that medium- and long-term inflation expectations remain subdued (pages 7,8,10). But, this comforting view does not alleviate the stress on major economies and construction pipelines in the short term.
Chronic inflation risk will likely be mitigated by real estate’s ability to work as a partial inflation hedge, although this ability is uneven across markets and sectors. This is because real estate has performed best as an inflation hedge when landlords have pricing power to push market rents. Today, this pricing power is in place for many property types favoured by investors. Moreover, this inflation hedging performs best when rising utility costs can be passed through to tenants via “triple net” leases, rental indexation and shorter lease terms. Inflation also contributes to higher construction costs, which means higher replacement costs, extended construction periods and slowdown of development pipelines. In the past, this has supported resilient values for standing assets during periods of elevated inflation. There are no guarantees that this resilience will occur, but the pieces are in place for a strong inflation hedge effect again.
From an investor’s perspective, geo-political tensions would appear to represent a chronic malady of the post-globalization era. Examples of authoritarianism, geopolitical disputes, populism, and nationalism can be found across the world. Important measures to watch are: geopolitical risk (page 3), the health of democracy (page 13) and real estate transparency. According to EIU’s Democracy Index 2022, the scores have been falling in many countries, due to pandemic restrictions that meant many countries struggled to balance public health with personal freedom. On the bright side, JLL and LaSalle’s soon-to-be released Global Real Estate Transparency Index shows marked improvements in three categories: sustainability reporting, proptech adoption, and data tracking of alternative property types. Rising transparency may not counter all the negative effects of falling democracy; but data availability and strong property rights have historically underpinned the free movement of capital to real estate.
The progression from acute to chronic has another positive aspect. The transition allows investors to underwrite assets with the new risks accounted for. During the acute stage, investment decision-making can become paralyzed. In the chronic stage, investors can begin to make longer-term risk adjustments that anticipate the long-term trajectory of the situation.
The transition from pandemic to endemic
On March 11, 2020, the World Health Organization (WHO) declared COVID-19 a pandemic.
As the pandemic enters its third year, there is a growing consensus that COVID-19 variants are likely here to stay. The world will need to adapt to this endemic phase as new, milder variants are likely to continue to emerge. The decline in the number of reported new cases worldwide and the accelerated vaccination efforts have boosted public confidence. In February, Denmark became the first European Union member state to lift its COVID-19 measures. Other European countries and the United States have also eased restrictions. Last week, Ursula von der Leyen (the European Commission President) and Dr. Anthony Fauci (the US infectious disease expert) both declared that the acute phase of the pandemic phase may be over — at least for now.
As the pandemic enters its third year, there is a growing consensus that COVID-19 variants are likely here to stay. The world will need to adapt to this endemic phase as new, milder variants are likely to continue to emerge.
Similarly, many countries in the Asia Pacific region are also transitioning to living with COVID-19. The Asia Pacific region has been relatively successful in keeping the coronavirus at bay over the last two years. As a result, some countries in the region, like China, were able to restart their economies relatively quickly and limit the economic impact of the pandemic. However, the emergence of the highly contagious Omicron variant has pushed governments in the region to re-impose strict measures to give their healthcare system time to recalibrate and set the stage for living with COVID-19. While many countries in the Asia Pacific region are moving towards living with COVID-19, China has maintained a zero-COVID policy. Since March 2022, the Chinese government re-introduced mass PCR testing and lockdowns in “high risk” neighborhoods of several Chinese cities to curb the Omicron variant outbreak. In April 2022, the IMF and other economists gave China a modest downgrade on its growth outlook, although these revised estimates remain higher than any major European or North American economy. On April 28th, President Xi made a solid commitment to increase infrastructure spending to counter slowing growth. In addition, the People’s Bank of China’s has re-committed to easing monetary policies. These efforts are expected to offset some negative impacts from the zero-COVID policy. We expect the recovery of occupier markets in China to be delayed, but not detoured.
Australia, Singapore, and South Korea are among the leading countries in the Asia Pacific region that are making the transition to living with COVID-19, helped by their stabilizing infection rates, and rapid vaccination/booster rollout. As of the end of April 2022, Australia, Singapore, and South Korea have eased nearly all COVID-19 safety measures and re-opened their borders to fully-vaccinated foreign visitors without the need for quarantine. Japan is also moving toward living with COVID-19, albeit at a slower pace than Australia, Singapore, and South Korea, after its quasi-state of emergency was lifted on March 21, 2022.
The relaxation of public health measures and the transition to living with COVID-19 have been highly beneficial for real estate demand. In the Asia Pacific region, the relaxation of social distancing measures and the strong willingness to return to offices has supported the recovery of office demand, especially in countries leading the transition from pandemic to endemic. In this month’s deck we track work from home expectations around the world (see p.3). Office markets like the Sydney CBD and Seoul saw vacancy rate improvements since the height of the pandemic, while other office markets, such as the Singapore CBD, had a positive net effective rent growth. Although rents in the Tokyo Central office market continued to decline in the first quarter of 2022 due to the quasi-state of emergency, the average vacancy rate in the Tokyo Central office market remained the lowest among major office markets in the Asia Pacific region. Major office markets across Europe show a similar recovery, although North American office markets still lag and the recovery in the largest US office markets is tepid at best.
Looking ahead, the transition from the pandemic to the endemic stage is expected to continue to support the recovery in real estate demand. However, other macro forces are now taking center stage as Covid retreats. Russia’s invasion of Ukraine, rising inflation, and interest rate hikes could cast a shadow on the recovery. Therefore, as shown in this month’s deck, the pace of improving real estate fundamentals varies greatly in cities around the world. Investors will need to pay close attention to these cross currents when underwriting new investments and adjusting portfolios.
Strong returns and value growth in the second half of 2021, buoyed by outperformance by the industrial and multifamily sectors, are giving real estate strong momentum heading into 2022. The value of U.S. and Canadian real estate relative to other asset classes is leading to strong capital flows and in turn is driving up prices. LaSalle’s 2022 Investment Strategy Annual (ISA) also speaks to the surprises of 2021 like lingering inflation and sector laggards that are still on investors’ minds.
LaSalle clients can view the full report at: www.lasalle.com/isa
As the 2021 ISA forecasted, low borrowing costs, a strengthening economy, increasing vaccinations and rolling re-openings have boosted investor demand for U.S. and Canadian real estate. The outlook for 2022 remains positive, though the report notes that investors should continue to be nuanced in their approach to avoid potential potholes.
Jacques Gordon, Global Head of Research and Strategy at LaSalle, said: “Real estate has shifted from capital-starved to capital-rich several times already in this century. The most recent supply of capital has more than kept pace with the rebound in deal flow. This creates challenges for the deployment of fresh money, even as it boosts the performance of assets already in a portfolio.
“Additionally, more is being asked of real estate in several different directions all at once. Sustainability criteria and rising tenant expectations are among the “asks” that investors must respond to. This raises the bar for putting societal and environmental goals alongside traditional financial targets when investing in real estate”.”
Select 2022 ISA findings for North America include:
The biggest economic surprise in 2021 was the return of inflation which has been more persistent than expected and has had a direct effect on several aspects of real estate, including development. However, the 2022 ISA presents a base case of moderate inflation moving forward, which may have more muted effects on the industry.
The role Net Asset Valued (NAV) REITs are playing in bringing new capital to the real estate market. Fueled by high-net-worth investors both in the U.S. and abroad who are looking for core real estate with long-term cash yields, these vehicles fared particularly well in 2021 with upwards of $25 billion in equity raised, bringing more than $50 billion with leverage of new buying power to the real estate market. The 2022 ISA looks at whether this trend will continue next year.
Sustainability is continuing to emerge as an investment imperative. For North American real estate investors, sustainability considerations present a set of new investment strategy questions stemming from market and regulatory diversity. For the U.S. and Canada, there is the question of how climate change will affect different regions and markets and how much that will impact relative market investment performance.
The 2022 ISA presents a prediction that the apartment and industrial sectors continue to outperform. The report notes that, despite insatiable demand (particularly within industrial), new supply has not been able to keep up and rental growth looks positive over the next several years. On the other hand, office remains a question mark with a large bid-ask gap that will ultimately need to be corrected but may take some time depending on workers’ return dates, how tenants will use space and whether they will need as much space moving forward. Likewise, retail continued to struggle despite pent up consumer demand and savings, though grocery-anchored retail is again attracting investor interest.
The 2022 ISA shows that while gateway cities may have been negatively impacted during the worst of the lockdowns, apartment demand is on the upswing. However, investors may find better relative value in secondary markets where population in-flows have been the strongest and the cost of living is significantly less than major gateway cities.
The investment universe for real estate continues to expand, with Canadian and U.S, investors alike considering a variety of specialty sectors like medical office, single-family rental, data centers and self-storage. Single-family has drawn particular attention as Millennials look to start families and age out of urban centers, a trend which may have been accelerated by the pandemic.
Rich Kleinman, Americas Co-CIO and Head of U.S. Research & Strategy at LaSalle, said, “The outset of 2021 presented numerous challenges and with unclear outcomes, but what has become clear is the resiliency of real estate. Looking ahead to 2022, investors who understand the nuance of sector selection, in-sector differentiation and the interplay between a continued economic recovery and real estate values should find success in real estate as 2021’s momentum continues. Robust transaction activity in the second half of 2021 has cleared up pricing for some sectors, and that should continue into 2022.”
Chris Langstaff, Head of Research and Strategy for Canada at LaSalle, said, “A renewed government focus on increasing immigration, continued rollout of vaccines and boosters, and an expansion of the investment universe all bode well for Canadian real estate investment in 2022. Fundamentals in the Canadian market are rebounding, making the country a strong investment option for 2022.”
Forward looking statement
The information discussed above is based on the market analysis and expectations of LaSalle and should not be relied upon by the reader as research or investment advice regarding LaSalle funds or any issuer or security in particular. The information presented herein is for illustrative and educational purposes and is not a recommendation, offer or solicitation to buy or sell any securities or to adopt any investment strategy in any jurisdiction where prohibited by law or where contrary to local law or regulation. Any such offer to invest, if made, will only be made to certain qualified investors by means of a private placement memorandum or applicable offering document and in accordance with applicable laws and regulations. Past performance is not indicative of future results, nor should any statements herein be construed as a prediction or guarantee of future results.
About LaSalle Investment Management
LaSalle Investment Management is one of the world’s leading real estate investment managers. On a global basis, we manage approximately $77 billion of assets in private equity, debt and public real estate investments as of Q4 2021. The firm sponsors a complete range of investment vehicles including open- and closed-end funds, separate accounts and indirect investments. Our diverse client base includes public and private pension funds, insurance companies, governments, corporations, endowments and private individuals from across the globe. For more information please visit www.lasalle.com and LinkedIn.
NOTE: This information discussed above is based on the market analysis and expectations of LaSalle and should not be relied upon by the reader as research or investment advice regarding LaSalle funds or any issuer or security in particular. The information presented herein is for illustrative and educational purposes and is not a recommendation, offer or solicitation to buy or sell any securities or to adopt any investment strategy in any jurisdiction where prohibited by law or where contrary to local law or regulation. Any such offer to invest, if made, will only be made to certain qualified investors by means of a private placement memorandum or applicable offering document and in accordance with applicable laws and regulations. Past performance is not indicative of future results, nor should any statements herein be construed as a prediction or guarantee of future results.
Company news
Jun 18, 2025 LaSalle acquires Ruby Stella Hotel in Clerkenwell
The five-building industrial complex was acquired on behalf of the LaSalle Property Fund.
Feb 11, 2025 Kunihiko Okumura and Steve Hyung Kim appointed Asia Pacific leaders
Keith Fujii to assume the role of Chairman of Asia Pacific, with all changes to be effective July 1, 2025.
Make sure you’ve spelled everything correctly, or try searching for something else. If you still can’t find what you’re looking for, you can always Contact us to talk to someone.
London ranks as Europe’s leading city for projected real-estate occupier demand for the fifth year running in the latest annual edition of the newly named European Cities Growth Index (“ECGI”), published by LaSalle Investment Management (“LaSalle”), the global real estate investment manager. Post-pandemic Paris, however, has closed the gap with its main rival since the 2020 edition, thanks to persistently strong human capital in Paris combined with softening prospects in service sector employment in London.
Top-performing European cities, London and Paris included, showed strength and resilience during the recent downturn triggered by the pandemic, displaying stable scores on average. Other top-performing cities such as Stockholm (fourth), Luxembourg (fifth) and Munich (sixth) recorded scores close to their 2019 pre-pandemic equivalents. The recovery in Spanish cities such as Madrid (rising to third place in the rankings), Barcelona (seventh) and Seville (fourteenth) exceeded most cities in Europe.
By contrast, the lower-ranking cities are getting weaker on a relative basis. 49 of the 93 European cities tracked by LaSalle in the ECGI recorded a year-on-year decline in score in 2021 – the highest number of decreases since 2009. As a result, the polarisation between the best- and worst-performing cities is getting wider.
Brian Klinksiek, Head of European Research and Global Portfolio Strategies at LaSalle, said: “This latest edition of the ECGI underlines the resilience of the London and Paris city markets, which has seen these ‘Big Two’ dominate the rankings since their launch in 2000. This is a highly challenging macroeconomic environment, with the largest number of cities seeing a downgrade in their growth prospects since the global financial crisis. Despite this, and the impact of a harder Brexit deal than previously anticipated, both London and Paris remain distinguished by their high-calibre workforces, strong GDP and employment growth prospects and comparatively low levels of business risk.”
“While the pandemic upturned many longstanding assumptions about the function of different real estate property types, we remain convinced that the growth metrics tracked in the ECGI will continue to provide a valuable tool in identifying real estate markets with room for outperformance, allowing investors to optimise portfolio construction when considered alongside supply-side information and relative pricing. It’s exciting this year to see multiple Spanish cities emerging as potentially attractive investment destinations on account of their strong recovery from the pandemic.”
Uwe Rempis, Managing Director and Fund Manager of LaSalle E-REGI, added: “This flagship piece of market research has been a crucial input for the investment process of LaSalle E-REGI over the last decade; on the back of this we have constructed a strong, diversified portfolio. This year’s theme of a widening polarisation between the best and worst performers post-pandemic is something that I have also seen on the ground across regions, micro-locations and individual assets. Our Fund’s focus will therefore remain on building portfolios with exposure to Europe’s most resilient city markets.”
The European Cities Growth Index has been renamed from the European Regional Economic Growth Index (“E-REGI”), the name under which LaSalle has previously published this annual research since 2000. The index identifies the European regions and cities with the best combination of growth prospects (in terms of GDP, service employment and human capital), current wealth and business environment. Together these can serve as a proxy for occupier demand and a framework for real estate portfolio construction. LaSalle continually refines its methodology and this year incorporated transparency around areas such as investment performance, regulatory landscape and sustainability into its assessment criteria.
About LaSalle Investment Management
LaSalle Investment Management is one of the world’s leading real estate investment managers. On a global basis, we manage approximately $77 billion of assets in private equity, debt and public real estate investments as of Q4 2021. The firm sponsors a complete range of investment vehicles including open- and closed-end funds, separate accounts and indirect investments. Our diverse client base includes public and private pension funds, insurance companies, governments, corporations, endowments and private individuals from across the globe. For more information please visit www.lasalle.com and LinkedIn.
NOTE: This information discussed above is based on the market analysis and expectations of LaSalle and should not be relied upon by the reader as research or investment advice regarding LaSalle funds or any issuer or security in particular. The information presented herein is for illustrative and educational purposes and is not a recommendation, offer or solicitation to buy or sell any securities or to adopt any investment strategy in any jurisdiction where prohibited by law or where contrary to local law or regulation. Any such offer to invest, if made, will only be made to certain qualified investors by means of a private placement memorandum or applicable offering document and in accordance with applicable laws and regulations. Past performance is not indicative of future results, nor should any statements herein be construed as a prediction or guarantee of future results.
Company news
Jun 18, 2025 LaSalle acquires Ruby Stella Hotel in Clerkenwell
The five-building industrial complex was acquired on behalf of the LaSalle Property Fund.
Feb 11, 2025 Kunihiko Okumura and Steve Hyung Kim appointed Asia Pacific leaders
Keith Fujii to assume the role of Chairman of Asia Pacific, with all changes to be effective July 1, 2025.
Make sure you’ve spelled everything correctly, or try searching for something else. If you still can’t find what you’re looking for, you can always Contact us to talk to someone.
The re-opening of the world economy, the re-emergence of leasing activity, and a pickup in capital market transactions have all brought a strong sense of optimism to real estate investors at the midway point in 2021, according to LaSalle’s 2021 Mid-Year Investment Strategy Annual (ISA) Report.
The ability for Asia Pacific, as a region, to rebound from the pandemic is remarkable. Asia Pacific’s rapid containment of the initial COVID-19 outbreak, along with a series of emergency fiscal stimulus actions at record speed, facilitated the economic recovery in Asia Pacific earlier than other regions in the world, even without the higher rollout of vaccines achieved. The accelerated vaccine rollouts in China and developed Asia Pacific countries and the economic recovery in North America and Europe could also provide a tailwind for Asia Pacific. All of these are driving several regional trends that benefit real estate investment performance, such as the rise of the middle class, growing consumption, the expansion of intra-regional trade and supply-chain networks, and an increase in investments in technology and urban infrastructure.
Domestic consumption – particularly e-commerce – is expected to continue to drive warehouse demand in the region. The willingness to return to offices continues to set Asia Pacific apart from other regions, although we expect performance dispersion among major office markets in the region. Office demand in major Asia Pacific markets, on an aggregated basis, experienced just one quarter of negative absorption to date during the pandemic. The overall more positive outlook than other regions and the depth of investor interest make it a continued sector of interest. LaSalle also continues to favor the multifamily sector, particularly in Japan, as a key allocation in core investors’ portfolios, on the back of stability of income.
Sustainable investment policies took center stage for many more asset owners during the pandemic. These considerations are expected to play a large role in Asia Pacific and many countries have announced their roadmaps to carbon neutrality. As a result, investors and occupiers are paying more attention to sustainability standards.
Elysia Tse, Head of Asia Pacific Research & Strategy at LaSalle Investment Management, said, “We continue to focus on our favored sectors, particularly logistics and multifamily in the region, and major Japan real estate markets and sectors, as economic activity picks up. In addition, we favor investment opportunities in select office markets to ride the recovery. For risk-tolerant investors, we focus on finding relative value in less favored sectors such as hotels and retail.”
About LaSalle Investment Management
LaSalle Investment Management is one of the world’s leading real estate investment managers. On a global basis, we manage approximately $77 billion of assets in private equity, debt and public real estate investments as of Q4 2021. The firm sponsors a complete range of investment vehicles including open- and closed-end funds, separate accounts and indirect investments. Our diverse client base includes public and private pension funds, insurance companies, governments, corporations, endowments and private individuals from across the globe. For more information please visit www.lasalle.com and LinkedIn.
NOTE: This information discussed above is based on the market analysis and expectations of LaSalle and should not be relied upon by the reader as research or investment advice regarding LaSalle funds or any issuer or security in particular. The information presented herein is for illustrative and educational purposes and is not a recommendation, offer or solicitation to buy or sell any securities or to adopt any investment strategy in any jurisdiction where prohibited by law or where contrary to local law or regulation. Any such offer to invest, if made, will only be made to certain qualified investors by means of a private placement memorandum or applicable offering document and in accordance with applicable laws and regulations. Past performance is not indicative of future results, nor should any statements herein be construed as a prediction or guarantee of future results.
Company news
Jun 18, 2025 LaSalle acquires Ruby Stella Hotel in Clerkenwell
The five-building industrial complex was acquired on behalf of the LaSalle Property Fund.
Feb 11, 2025 Kunihiko Okumura and Steve Hyung Kim appointed Asia Pacific leaders
Keith Fujii to assume the role of Chairman of Asia Pacific, with all changes to be effective July 1, 2025.
Make sure you’ve spelled everything correctly, or try searching for something else. If you still can’t find what you’re looking for, you can always Contact us to talk to someone.
Real estate markets are beginning to stabilize and even show growth in the U.S. and Canada as large-scale COVID-19 vaccination programs enable economic re-openings across North America, according to the LaSalle Research & Strategy’s 2021 Mid-Year Investment Strategy Annual (ISA). However, much like in the full-year report published at the close to 2020, uncertainty remains around specific property types and inflation.
With the backdrop of a strengthening economy and rolling re-openings, the report notes that real estate returns have exceeded expectations in the first half of the year, leading LaSalle to upgrade its return outlook for the remainder of the year. The improved outlook is bolstered by strong investor demand for favored property types and low borrowing costs that are attracting investors to real estate.
Jacques Gordon, Global Head of Research and Strategy at LaSalle, said: “For real estate investors around the world, the pandemic rocked the foundation of the asset class. As our Mid-Year Update reveals, real estate has generally survived intact, and many markets are thriving in novel ways. However, for every property sector or specific location with robust demand, there is another sector facing serious headwinds and existential questions. The pandemic accelerated technology trends in virtually every aspect of our lives – from remote working, tele-health, distance learning, and the deepening of e-commerce. Additionally, the pandemic accelerated the adoption of sustainability policies by investors and by occupiers of real estate, a move that has many implications for how LaSalle invests in and operates its real estate holdings going forward.”
Select 2021 Mid-Year ISA findings for North America include:
An update on the global “Future of…” series, which provides forward-looking perspective into the office, retail, logistics, residential and niche property sectors in North America and around the world.
Vaccination efforts and lower COVID-19 case counts are allowing for greater mobility among U.S. and Canadian populations, breathing life back into some of the property sectors most acutely affected by the pandemic. While the office and retail sectors are lagging behind “in-favor” sectors such as apartments and industrial, there are bright spots emerging as people return to the office and foot traffic accelerates at select retail properties.
Meanwhile, the apartment and industrial sectors continue to outperform. Cap rates in these sectors compressed 50 basis points or more during the first half of the year to all-time lows as investor demand for warehouses remains insatiable and apartment properties benefitted from record setting demand.
A major theme of the full-year ISA was how the pandemic would affect the dynamic between urban and suburban markets. As expected, suburban properties have outperformed, benefitting from an acceleration of pre-pandemic demographic trends and people looking to avoid the more restrictive, close-in urban centers amid the pandemic. LaSalle projected an urban rebound, and that is starting to materialize, illustrated by accelerating urban apartment rent growth in April and May.
There remains uncertainty in the market especially as it pertains to inflation. While the U.S. Federal Reserve and Bank of Canada have taken the view that increases in inflation are transitory and kept rates low, this raises the risk that inflation will be higher for longer if policy makers’ views are proven incorrect. Inflation is already affecting real estate development. For instance, residential construction prices rose 12.5% and 11.7% year-over-year in the U.S. and Canada, respectively, and General Contractors are passing on these higher costs to investors. The real estate market will have to adjust and that will occur through a combination of: 1) Investors accepting a lower yield on cost; 2) Rejection of development projects that do not deliver an acceptable return; 3) Underwriting higher rents to counter the impact of higher costs; or 4) Land values declining to compensate for the higher costs.
Rich Kleinman, Americas Co-CIO and Head of U.S. Research & Strategy at LaSalle, said, “As we anticipated earlier this year, rising vaccination rates and a steady re-opening in the U.S. are drawing investors back to real estate. As investment activity recovers the key choice is whether to pursue relative value in some sectors that have been more challenged during the pandemic, or join the robust flow of capital heading into favored sectors. As more properties transact, clearer pricing will help provide more clarity around this decision, enabling a more liquid market as the year progresses.”
Chris Langstaff, Head of Research and Strategy for Canada at LaSalle, said, “Earlier in the year we discussed that the speed at which the pandemic can be contained in 2021 would largely determine the strength of Canada’s economic recovery. While the vaccine rollout in Canada initially lagged the U.S., it is now quickly catching up, providing positive tailwinds for the real estate market. Historically low borrowing rates and improving NOI and fundamentals are providing a further boost.”
About LaSalle Investment Management
LaSalle Investment Management is one of the world’s leading real estate investment managers. On a global basis, we manage approximately $77 billion of assets in private equity, debt and public real estate investments as of Q4 2021. The firm sponsors a complete range of investment vehicles including open- and closed-end funds, separate accounts and indirect investments. Our diverse client base includes public and private pension funds, insurance companies, governments, corporations, endowments and private individuals from across the globe. For more information please visit www.lasalle.com and LinkedIn.
NOTE: This information discussed above is based on the market analysis and expectations of LaSalle and should not be relied upon by the reader as research or investment advice regarding LaSalle funds or any issuer or security in particular. The information presented herein is for illustrative and educational purposes and is not a recommendation, offer or solicitation to buy or sell any securities or to adopt any investment strategy in any jurisdiction where prohibited by law or where contrary to local law or regulation. Any such offer to invest, if made, will only be made to certain qualified investors by means of a private placement memorandum or applicable offering document and in accordance with applicable laws and regulations. Past performance is not indicative of future results, nor should any statements herein be construed as a prediction or guarantee of future results.
Company news
Jun 18, 2025 LaSalle acquires Ruby Stella Hotel in Clerkenwell
The five-building industrial complex was acquired on behalf of the LaSalle Property Fund.
Feb 11, 2025 Kunihiko Okumura and Steve Hyung Kim appointed Asia Pacific leaders
Keith Fujii to assume the role of Chairman of Asia Pacific, with all changes to be effective July 1, 2025.
Make sure you’ve spelled everything correctly, or try searching for something else. If you still can’t find what you’re looking for, you can always Contact us to talk to someone.
Asia Pacific has come through the pandemic in stronger shape than any other region to date. Uncertainty will remain a dominant theme in 2021, although there are signs of bifurcated economic and real estate market performance in the region, according to the LaSalle Investment Strategy Annual (ISA) 2021.
China, in particular, is exhibiting a V-shaped recovery amid the pandemic-led recession. The success of the region can be largely contributed to the role of governments, high trust in local institutions, ultra-accommodative monetary policies, and the record size of fiscal stimulus packages in major Asia Pacific countries. The vaccine deployment in the region is also expected to further support the recovery. These stabilizing influences accompanied by trends we have identified in the past—the rise of intra-regional trade and the steady rise of transparency—help reduce the effects of post-pandemic uncertainty.
Countries with relative success in keeping the pandemic under control, a significantly large domestic demand base, effective monetary and fiscal stimulus packages, and room for more stimulus are expected to lead the economic recovery in the region. The ranking of the relative strength of major Asia Pacific economies in a post-pandemic outlook has China leading, followed by Japan, South Korea, Singapore, Australia, and Hong Kong. This reinforces our conviction that domestic and intra-regional recovery in Asia Pacific will contribute more to the economic recovery in the region than external influences from outside the region.
Real estate sector shift
The pandemic has accelerated the shift toward online retailing, enhancing the strong demand for logistics. The increase in logistics transaction volume has primarily been at the expense of the retail sector. The robust investor demand for logistics facilities across the globe and in the Asia Pacific region in recent years is expected to expand the investable universe of the sector in 2021 and beyond. The pandemic has also accelerated the attractiveness of multi-families in Japan, the only institutionalized multi-family market in Asia Pacific, and the rise of the multi-family sector in the rest of the region, for example China. The ongoing sector shift is likely to drive investors, particularly asset allocators, to broaden their real estate portfolios to include more logistics and multi-family assets in Asia Pacific as a way to complement other property types.
Jacques Gordon, Global Head of Research and Strategy at LaSalle, said: “In the 2021 edition of the ISA, our advice for investors is to hold the course. On the other side of the pandemic lies a landscape that real estate investors will recognize, even if it will also be different in surprising ways. The strength of the post-vaccine recovery could be one of those surprises. The secular trends we follow have been simultaneously accelerated and interrupted, and as a result, we undertake a global look at the future of the mainline property types, while also focusing on the rise of viable alternatives.”
Keith Fujii, Asia Pacific CEO at LaSalle, said: “Compared to other regions around the world, several Asia Pacific countries have been the first to be on the path of economic recovery. That means we will continue to see strong investor appetite this year for Asia Pacific real estate, particularly in Japan with sustained resiliency and China where the economy and property markets are rebounding. The shift to digital commerce is expected to continue in 2021 and so will the capital flows into logistics assets in the region. Broad-based distress is unlikely in the region, but there’s potential for some distressed or repricing opportunities from financially challenged developers and asset owners.”
Elysia Tse, Head of Asia Pacific Research and Strategy at LaSalle, said: “The future of office properties has been the most debated among major property types globally. We believe there are a few key areas that differentiate major office markets in Asia Pacific. First, the human behavioral influence on tenant occupancy decisions – the progress of returning to the office has been the most advanced in Asia Pacific – the sooner people can and are willing to return to work in their offices, the lesser the permanent impact of remote working on the future of offices. Second, a cultural element, face-to-face meetings in a formal office setting represent high business value and are viewed as essential business rituals in countries such as China, Japan, and South Korea. Third, the relatively small residential unit size in several highly urbanized Asian cities, for example in Japan, makes working from home challenging in the long term. One of the key values of physical office space is collaboration. Despite the relative success of working from home, it is likely to be one of the options, but not a permanent replacement for office space in major Asia Pacific markets.”
LaSalle Investment Management is one of the world’s leading real estate investment managers. On a global basis, we manage approximately $77 billion of assets in private equity, debt and public real estate investments as of Q4 2021. The firm sponsors a complete range of investment vehicles including open- and closed-end funds, separate accounts and indirect investments. Our diverse client base includes public and private pension funds, insurance companies, governments, corporations, endowments and private individuals from across the globe. For more information please visit www.lasalle.com and LinkedIn.
NOTE: This information discussed above is based on the market analysis and expectations of LaSalle and should not be relied upon by the reader as research or investment advice regarding LaSalle funds or any issuer or security in particular. The information presented herein is for illustrative and educational purposes and is not a recommendation, offer or solicitation to buy or sell any securities or to adopt any investment strategy in any jurisdiction where prohibited by law or where contrary to local law or regulation. Any such offer to invest, if made, will only be made to certain qualified investors by means of a private placement memorandum or applicable offering document and in accordance with applicable laws and regulations. Past performance is not indicative of future results, nor should any statements herein be construed as a prediction or guarantee of future results.
Company news
Jun 18, 2025 LaSalle acquires Ruby Stella Hotel in Clerkenwell
The five-building industrial complex was acquired on behalf of the LaSalle Property Fund.
Feb 11, 2025 Kunihiko Okumura and Steve Hyung Kim appointed Asia Pacific leaders
Keith Fujii to assume the role of Chairman of Asia Pacific, with all changes to be effective July 1, 2025.
Make sure you’ve spelled everything correctly, or try searching for something else. If you still can’t find what you’re looking for, you can always Contact us to talk to someone.
LaSalle is projecting that the U.S. and Canadian real estate markets will begin to recover in 2021 as market conditions thaw amid the accelerating rollout of COVID-19 vaccines and the associated economic rebound. Increasing clarity is expected throughout the year on real estate pricing and the direction of government policy. However, according to LaSalle’s 2021 Investment Strategy Annual (ISA), uncertainty remains for certain property types including office, retail and lodging as long-term hurdles remain.
LaSalle is projecting that Gross Domestic Product (GDP) will recover to prior peak levels by the end of 2021 and job growth to follow by 2022–23, with Canada slightly leading the U.S. in terms of jobs recovery. The ISA advises investors to expect a virtuous cycle of increased spending on services leading to business expansion and hiring in late 2021 and into 2022.
Jacques Gordon, Global Head of Research and Strategy at LaSalle, said: “In the 2021 edition of the ISA, our advice for investors is to hold the course. On the other side of the pandemic lies a landscape that real estate investors will recognize, even if it will also be different in surprising ways. The strength of the post-vaccine recovery could be one of those surprises. The secular trends we follow have been simultaneously accelerated and interrupted, and as a result, we undertake a global look at the future of the mainline property types, while also focusing on the rise of viable alternatives. Each country we follow will experience the post-Covid recovery differently. The U.S. and Canada will benefit from healthy capital markets — both debt and equity — and a strong consumer rebound.”
Select ISA 2020 findings for the U.S. include:
Throughout 2020, uncertainty about values weighed on capital flows to real estate. But in 2021 and 2022, this pricing uncertainty is expected to clear as capital flows rebound. Importantly, in the U.S. there continue to be property types that can be categorized as “winners” amid historically wide differences in pricing and investor interest. Those property types include industrial, suburban apartments, and some specialty property types, such as medical office, life sciences real estate, and self-storage. Meanwhile, uncertainty remains around conventional office and malls, though questions remain about whether headwinds such as remote working and e-commerce affecting these property types are permanent or temporary.
The pandemic is limiting activity in urban cores in the near term, with apartment demand and rent growth in urban areas severely lagging suburban locations. Real estate investors are right to ask if these are temporary or permanent changes. Pre-pandemic dynamics including ample supply, higher relative yields and favorable demographics were already providing tailwinds for suburban apartments, which were further accelerated by the desire for space amid the COIVD-19 outbreak. Nonetheless, the ISA advises investors to watch for a recovery for urban locations, which will drive demand for urban apartments, offices, and to some extent retail, as the pandemic comes under control and the amenities of urban living once again re-open.
The attractiveness of “secondary” markets will be emphasized throughout 2021 relative to the so-called “primary” or “gateway” markets in the U.S. (e.g., Boston, New York City, Washington DC, Chicago, San Francisco, and Los Angeles). In addition to headwinds such as regulatory burdens, climate risks, property tax risk, and growth challenges of the gateway markets are increasing. Markets with a stronger growth outlook and less regulatory and climate risk, particularly those in the Sunbelt, may pique investor interest as pricing clarity and capital flows evolve through 2021.
Rich Kleinman, Americas Co-CIO and Head of U.S. Research & Strategy at LaSalle, said, “While there remains some uncertainty around certain property types as we head into 2021, on the whole, we see U.S. real estate providing a compelling value proposition for diversified investors. We believe with continued low interest rates, real estate will remain a critical source of long-term yield for investors even amid some short-term headwinds caused by the pandemic.”
Canadian Outlook
While Canada initially coped well in the face of COVID-19 by drawing on prior experience with SARS, Western Canada has been hit hard by the collapse in energy prices and COVID-19 cases are rising across the country in a pattern similar to the U.S. Ultimately, the Canadian economy was one of the hardest hit during the pandemic, but the ISA shows it is also poised for one of the largest rebounds. While the Canadian jobs recovery is expected to outpace that of the U.S. in 2021, much of the same questions remain for North America’s second largest economy heading into the year. Like the U.S., questions remain about whether there will be further economic stimulus, which proved effective earlier in 2020 and will likely be needed to stave off a possible decline in economic activity. Likewise, questions remain about the attractiveness of urban versus suburban properties. In Canada, urbanization within the major metros has been a significant growth driver in recent years, but the pandemic is driving a renewed interest in suburban locations among companies (i.e., office tenants) and individuals (i.e., apartment and condo residents).
Chris Langstaff, Head of Research and Strategy for Canada at LaSalle, said, “The speed at which the pandemic can be contained in 2021 will largely determine the strength of Canada’s economic recovery. We expect continued strong levels of consumer spending and a recovery in trade and output to drive economic growth, while a resumption of immigration will drive population growth. While many service-driven sectors like retail and lodging remain depressed due to limitations on gatherings, we expect a rebound in the second half of 2021.”
About LaSalle Investment Management
LaSalle Investment Management is one of the world’s leading real estate investment managers. On a global basis, we manage approximately $77 billion of assets in private equity, debt and public real estate investments as of Q4 2021. The firm sponsors a complete range of investment vehicles including open- and closed-end funds, separate accounts and indirect investments. Our diverse client base includes public and private pension funds, insurance companies, governments, corporations, endowments and private individuals from across the globe. For more information please visit www.lasalle.com and LinkedIn.
NOTE: This information discussed above is based on the market analysis and expectations of LaSalle and should not be relied upon by the reader as research or investment advice regarding LaSalle funds or any issuer or security in particular. The information presented herein is for illustrative and educational purposes and is not a recommendation, offer or solicitation to buy or sell any securities or to adopt any investment strategy in any jurisdiction where prohibited by law or where contrary to local law or regulation. Any such offer to invest, if made, will only be made to certain qualified investors by means of a private placement memorandum or applicable offering document and in accordance with applicable laws and regulations. Past performance is not indicative of future results, nor should any statements herein be construed as a prediction or guarantee of future results.
Company news
Jun 18, 2025 LaSalle acquires Ruby Stella Hotel in Clerkenwell
The five-building industrial complex was acquired on behalf of the LaSalle Property Fund.
Feb 11, 2025 Kunihiko Okumura and Steve Hyung Kim appointed Asia Pacific leaders
Keith Fujii to assume the role of Chairman of Asia Pacific, with all changes to be effective July 1, 2025.
Make sure you’ve spelled everything correctly, or try searching for something else. If you still can’t find what you’re looking for, you can always Contact us to talk to someone.
Economies around the world have been damaged more severely than any peacetime event since World War II. Although none of us predicted a pandemic, it took this kind of tail-risk event to derail the Asia-Pacific region, the fastest growing region in the world. However, the combination of high levels of trust in Asia Pacific governments, an earlier start to the downturn and recovery, unprecedented monetary and fiscal stimulus packages, and the region’s important role in global supply chains, especially China lends resilience to the region. These macro factors, combined with high-frequency indicators, shed light upon our outlook for Asia Pacific economies and real estate markets, despite the uncertain duration of the pandemic, according to LaSalle’s mid-year Investment Strategy Annual (ISA) report.
Asia Pacific is likely to come out of the pandemic ahead of other regions due to the relative success of their public health policies. Nonetheless, like other regions, we expect to see setbacks caused by new outbreaks from time to time. LaSalle’s relative ranking of major Asia Pacific economies post COVID-19 recovery has China leading, followed by Japan, South Korea, Singapore, Australia and Hong Kong. Looking forward, larger the domestic economy, the stronger the pace of the country’s recovery is expected to be, with China, Japan and South Korea driving the recovery.
The pandemic accelerated existing trends that we have been following for many years in Asia Pacific, as well as several incipient trends, including: the rise of logistics, the demise of brick-and-mortar retailers, the market segmentation of residential properties (luxury, urban high-rise, mid-rise suburban, workforce, active adult, etc.), the mainstreaming of alternative or niche sectors, and the rising importance of technology as a driver for many real estate decisions. We continue to favour the logistics sector in the region. Looking forward we believe that professionally managed rental apartments present an interesting opportunity to consider in several Asia Pacific countries. With the exception of Japan, the apartment sector is not institutionalised in most parts of the region and it could be attractive to offer better amenities for residents and enable them to work from home in a better environment.
Jacques Gordon, Global Head of Research & Strategy at LaSalle Investment Management said, “The COVID-19 crisis and the ensuing global recession emphasize important lessons about portfolio construction. Property types respond very differently to global macro events, and their financial characteristics are affected by interest rate regimes, pandemics, or technology trends, which don’t respect national borders. This means that the performance of the principal property types is more dispersed than we have ever seen. During the cap rate compression era, all the main property types tended to converge in terms of performance. Now, in this downturn, the different risk-return characteristics of each property type come to the fore.
We believe that the key to making good investment decisions during a period of radical uncertainty is to avoid letting “recency bias” control your thought process. In other words, looking through and ahead of a crisis, like the current pandemic, will be important in order to survive and thrive. We believe all investors and indeed, societies-at-large, face the challenge to look beyond the darkest hour. Real estate, because it serves all industries and all segments of society, must pay especially close attention to the difference between temporary and permanent changes”.
Elysia Tse, Head of Research & Strategy for Asia Pacific at LaSalle Investment Management said, “Throughout the pandemic, real estate capital markets in Asia Pacific have generally been stable. Most investors are taking a wait-and-see view on new investments and focusing on existing portfolios. We have not seen substantial pricing discounts in Asia Pacific, despite the fact that we are in the worst recession of decades.
The biggest unknown lies in the outlook for property cash flows and Net Operating Income (NOI). If resurgences of infections get much worse than today or last much longer than anticipated, NOI could deteriorate further than anticipated—pricing movements could be partly driven by anticipation. Furthermore, the increase in capital market volatility is expected to drive flight-to-safety, keeping cap rates of core assets low. This trend is projected to widen the pricing differences between assets with secured cash flows and those without them. LaSalle’s logistics sector strategy in Asia Pacific has worked out well for us going into this pandemic. The logistics sector, although not immune to the impact of the COVID-19 pandemic, has been a relative winner of this global demand shock. In sum, the COVID-19 pandemic presents risks, but also potential opportunities in Asia Pacific, as investment managers play the arbitrage between the “haves” and the “have nots”.
About LaSalle Investment Management
LaSalle Investment Management is one of the world’s leading real estate investment managers. On a global basis, we manage approximately $77 billion of assets in private equity, debt and public real estate investments as of Q4 2021. The firm sponsors a complete range of investment vehicles including open- and closed-end funds, separate accounts and indirect investments. Our diverse client base includes public and private pension funds, insurance companies, governments, corporations, endowments and private individuals from across the globe. For more information please visit www.lasalle.com and LinkedIn.
NOTE: This information discussed above is based on the market analysis and expectations of LaSalle and should not be relied upon by the reader as research or investment advice regarding LaSalle funds or any issuer or security in particular. The information presented herein is for illustrative and educational purposes and is not a recommendation, offer or solicitation to buy or sell any securities or to adopt any investment strategy in any jurisdiction where prohibited by law or where contrary to local law or regulation. Any such offer to invest, if made, will only be made to certain qualified investors by means of a private placement memorandum or applicable offering document and in accordance with applicable laws and regulations. Past performance is not indicative of future results, nor should any statements herein be construed as a prediction or guarantee of future results.
Company news
Jun 18, 2025 LaSalle acquires Ruby Stella Hotel in Clerkenwell
The five-building industrial complex was acquired on behalf of the LaSalle Property Fund.
Feb 11, 2025 Kunihiko Okumura and Steve Hyung Kim appointed Asia Pacific leaders
Keith Fujii to assume the role of Chairman of Asia Pacific, with all changes to be effective July 1, 2025.
Make sure you’ve spelled everything correctly, or try searching for something else. If you still can’t find what you’re looking for, you can always Contact us to talk to someone.
While robust fiscal and monetary policy support has helped mitigate the economic impact of the pandemic in North America thus far, the performance of property markets and asset classes across the U.S. and Canada over the near- and long-term will vary significantly. These variances will be attributed to divergent health policies, consumer behavior around disease mitigation strategies and shifting lifestyle preferences. Despite these uncertainties, real estate remains a shock absorber against economic volatility, and the benefits of real estate for portfolio diversification and risk management have shone through amid the turmoil.
Heading into the pandemic, the U.S. and Canadian economies, and most of each country’s major real estate markets, were in a period of remarkable stability, characterized by low unemployment and vacancy rates, moderate value increases for most of the primary property types, and balanced supply and demand. These factors should support both countries as they navigate the crisis, despite near-term volatility and risks. While unemployment rates have risen sharply, they started at an all-time low. Moreover, the vast majority of unemployment spikes resulted from furloughs in impacted sectors such as travel and retail, and the expectation is that many of these jobs will return once circumstances stabilize. This does not eliminate the immediate impacts of high unemployment on individuals or the economy. However, the U.S. and Canadian labor markets are more fluid than others with higher levels of metro-to-metro migration, which should support the recovery.
Macro Perspective
Jacques Gordon, Global Head of Research and Strategy at LaSalle, said: “The ways that policy, geography, climate and human behavior interact with the diversity of regional economic drivers will determine the relative performance across markets and global real estate portfolios. In the near-term, leaders will be locations that appeal to technology, life sciences, and a noticeable improvement in migration to sunbelt markets. Laggards will be metros with high levels of new infections, and markets with the greatest exposure to tourism and energy. As we move into a post-COVID-19 world, we see a different set of drivers being critical to economic and real estate performance. When the dust settles on 2020, we expect that real estate will remain an important contributor to the performance of an investment portfolio through its income-generating ability and the different path it tends to take during up and down economic and capital market cycles.”
As it relates to investment strategies, opportunities exist for both real estate securities and indirect investors to capitalize on the wide gaps between public and private real estate valuations. Likewise, specialized debt investors can benefit from a less crowded competitive landscape and wider debt spreads. For core investors, inflection points and recessions can generate attractive entry points for long-term strategies.
The near-term relative performance across property types is reflected in the level of vacancy entering the downturn. Industrial and multifamily properties were well occupied and positioned strongly prior to the downturn, suggesting a near-term rise in vacancies followed by a quick recovery. Office had only moderate demand with higher vacancy rates, at levels just below the sector’s long-term average, which aligns with LaSalle’s forecast for a volatile downturn and slow recovery. Retail had been suffering from eroding brick-and-mortar sales and over-leverage, which may compound near-term weakness across retail segments and tip some properties into distress.
U.S. Trends
Rich Kleinman, Co-CIO, Americas & Head of U.S. Research and Strategy for LaSalle, said: “At this point in the pandemic recovery, there is limited visibility on real estate pricing, and only marginally more on the direction of capital flows. Transaction volumes have fallen sharply in the U.S. since March, and properties trading are those with the strongest buyer interest with limited value declines from pre-COVID-19 pricing. To determine where the market might be heading, we are focused on which pools of capital are active, what they are likely to target, and where capital seems to be lacking. As transaction activity picks up in the second half of the year, the market disruption should create opportunities for investors to fill the capital market gaps and take advantage of pricing shifts.”
The lack of visibility into pricing has made research, data and technology even more critical to informing investment decisions during the pandemic. In addition to leveraging information technology firms and health authorities have provided to the general public, other tools can be useful in assessing the pandemic’s impact on real estate. LaSalle is incorporating data from the Blavatnik School of Government at Oxford University, which tracks policies such as school closure, travel bans and other lockdown measures, and combines it with fiscal and monetary interventions – all of which can be leading indicators for the economy and risk asset markets. Moreover, the firm is analyzing hyperlocal mobile data from Safegraph, Google, Apple and health agencies to monitor the spread of COVID-19 and estimate how people are altering their social distancing behavior. This helps to track hot spots, predicting which markets may see deeper and longer lasting effects of the virus. Finally, keeping track of the aggregate movement of people and vehicles highlights the economic activities that are prioritized and the rate at which other economic activities recover, as well as geographic disparity in such activity.
The data efforts LaSalle has put in place in prior years have turned out to be very valuable for identifying potential trouble spots. These studies accentuate the importance of high-frequency data in our industry and the uses to which this data can be put to underwrite and manage real estate assets.
Canadian Outlook
Like many other countries, the Canadian government implemented robust fiscal and monetary policy support to help mitigate the economic impact of the pandemic. Nearly CAD $255 billion was approved at the federal level, or roughly 12% of GDP. If future stimulus is needed, the Canadian government appears more willing to extend unemployment benefits if needed. The Bank of Canada also quickly cut its Policy Rate to 0.25% and initiated bond buying for the first time in its history. This support has enabled lending to resume and provides many businesses with the footing needed to survive until the recovery and the capacity to expand when that recovery starts.
Chris Langstaff, Head of Research and Strategy in Canada for LaSalle said: “In Canada, office demand was strong in most markets, with the exception of Calgary and Edmonton, which have been weak since the 2014-15 oil price downturn. Industrial properties were near record low levels of availability, a key reason we expect the severity of this downturn to be less for industrial than past recessions. Apartments were also in a strong position with relatively low vacancy and a balanced supply and demand, but both at strong levels. This suggests the near-term will see rising vacancy and falling rents, but a quick recovery as new supply slows and the previous demand trends resume.”
About LaSalle Investment Management
LaSalle Investment Management is one of the world’s leading real estate investment managers. On a global basis, we manage approximately $77 billion of assets in private equity, debt and public real estate investments as of Q4 2021. The firm sponsors a complete range of investment vehicles including open- and closed-end funds, separate accounts and indirect investments. Our diverse client base includes public and private pension funds, insurance companies, governments, corporations, endowments and private individuals from across the globe. For more information please visit www.lasalle.com and LinkedIn.
NOTE: This information discussed above is based on the market analysis and expectations of LaSalle and should not be relied upon by the reader as research or investment advice regarding LaSalle funds or any issuer or security in particular. The information presented herein is for illustrative and educational purposes and is not a recommendation, offer or solicitation to buy or sell any securities or to adopt any investment strategy in any jurisdiction where prohibited by law or where contrary to local law or regulation. Any such offer to invest, if made, will only be made to certain qualified investors by means of a private placement memorandum or applicable offering document and in accordance with applicable laws and regulations. Past performance is not indicative of future results, nor should any statements herein be construed as a prediction or guarantee of future results.
Company news
Jun 18, 2025 LaSalle acquires Ruby Stella Hotel in Clerkenwell
The five-building industrial complex was acquired on behalf of the LaSalle Property Fund.
Feb 11, 2025 Kunihiko Okumura and Steve Hyung Kim appointed Asia Pacific leaders
Keith Fujii to assume the role of Chairman of Asia Pacific, with all changes to be effective July 1, 2025.
Make sure you’ve spelled everything correctly, or try searching for something else. If you still can’t find what you’re looking for, you can always Contact us to talk to someone.
The COVID-19 crisis has created unprecedented dispersion in the performance of the different types of principal real estate assets, primarily by accelerating pre-existing trends affecting European property markets, according to the 2020 Mid-Year Investment Strategy Annual (“Mid-Year ISA”) published by LaSalle Investment Management (“LaSalle”), the global real estate investment manager. While global transaction volumes fell sharply in H1 2020, long-standing factors such as the rise of logistics, the decline of apparel retailers and the mainstreaming of alternative sectors continued to drive real estate investment flows in the first half of the year
Retail: COVID-19 has compounded structural challenges facing the sector, such as the growth of e-commerce and changing consumer behaviour. These trends were already most progressed in the UK and, from January to April, online retail sales grew 30% year on year, while total retail sales declined 23%, increasing the share of online retail spend, or e-commerce penetration rate, to a record 31%. Consequently, LaSalle expects average UK retail property value, having fallen c.12% since 2018, to drop by another 20-30% in 2020. Other European markets are following: German online retail sales increased by 24% in April against an overall decline of 6%, albeit with online penetration of only 12%. Nonetheless, non-discretionary, grocer-anchored, open-air shopping centres remain well-positioned.
Logistics: Conversely, the structural shift to online retail, magnified by the pandemic, is a driver of demand for European distribution and fulfilment centres. Across different markets, LaSalle predicts e-commerce penetration to increase by 5%-15% from pre-coronavirus levels. Logistics assets have also benefited from emergency supply chain reorganisation, onshoring and the trend of maintaining higher inventory levels. However, physical retailers account for approximately one third of demand for European logistics, a figure set to diminish. There also remains an oversupply of motorway logistics assets exposed to technological advances such as autonomous vehicles and 3D printing.
Office: European office markets have been subject to the only pronounced reversal of a pre-existing trend, with patterns of migration towards large cities and rising population density receding during, and probably after, the pandemic. Financial, professional services and technology companies’ ability to work remotely has sustained income streams, with rent collection rates of over 80% for class-A offices globally. However, a combination of a global recession and higher rates of work from home, threaten medium-term demand. However, this should be partially mitigated by reduced workplace density; the long-standing undersupply of Europe’s largest office markets; and tenants seeking refurbished premises that enhance health and safety. Meanwhile, flexible offices have experienced short-term falls in cashflow but should benefit from increased demand in the longer term.
Residential and alternatives: Despite its relative immaturity from an institutional investor perspective, Europe’s residential property market has been the most resilient sector, with institutional-quality assets collecting more than 90% of rent globally. Residential properties have directly benefited from wage subsidy schemes and experienced increased short-term demand driven by lockdown-enforced illiquidity in house-buying markets. While the long-term robustness of their income streams will be tested through the impending economic contraction, index-linked ‘long-income’ assets have also proven highly resilient. The strong returns on offer from rental housing compared to investment-grade bonds, which are likely to continue record-low yields, have begun to attract interest from a wider array of investors. Within other alternatives, healthcare’s emergence as a mainstream sector has accelerated. Meanwhile, hotels and student accommodation have been adversely affected – with the latter facing a longer-term trade-off between its traditional countercyclical appeal during recession and the possible decline in overseas student numbers.
Jacques Gordon, Global Head of Research and Strategy at LaSalle Investment Management, said: “Despite the considerable uncertainty that has unfolded in the past six months, many of our previous strategic recommendations are holding true globally. We have consistently advocated increased exposure to logistics and advised that retail investments are concentrated in open-air assets, which have navigated the crisis better than enclosed malls. We believe that human capital will continue to thrive by returning to safe and secure offices throughout metropolitan areas, once work from home guidance is lifted. Our approach of limiting exposure to co-working operators as tenants but building out a proprietary flexible office offering has proven to be sound advice. Persistent income streams throughout the crisis have demonstrated the resilience of many office assets class globally. As economies reopen, there is an opportunity for investors to focus on the fundamentals and secular trends of demographics, technology and a more cautious approach to urban density.”
Simon Marx, Director of UK Research at LaSalle Investment Management, said: “The different risk-return characteristics of each property type come to the fore in a downturn and we have been encouraged by the resilience of our preferred strategies in Europe. Despite market illiquidity continuing to constrain deal flow, we see a range of sectors offering compelling investment opportunities, both in the UK and on the continent, in the latter half of the year. In the UK, long-income assets, such as ground leases and income strips, remain highly attractive relative to investment-grade bonds and offer a partial hedge to the risk of inflation in the medium term.”
About LaSalle Investment
Petra Blazkova, Director of Continental European Research, said: “On the continent, urban logistics, residential assets and even office properties offering secure income in markets with strong occupier fundamentals can be a high-quality defensive or income-generating addition to a portfolio. Meanwhile, throughout Europe, real estate debt strategies such as whole loans, mezzanine debt, development finance and other special situations can provide exposure to attractive supply-demand dynamics across the risk-return spectrum.”
About LaSalle Investment Management
LaSalle Investment Management is one of the world’s leading real estate investment managers. On a global basis, we manage approximately $77 billion of assets in private equity, debt and public real estate investments as of Q4 2021. The firm sponsors a complete range of investment vehicles including open- and closed-end funds, separate accounts and indirect investments. Our diverse client base includes public and private pension funds, insurance companies, governments, corporations, endowments and private individuals from across the globe. For more information please visit www.lasalle.com and LinkedIn.
NOTE: This information discussed above is based on the market analysis and expectations of LaSalle and should not be relied upon by the reader as research or investment advice regarding LaSalle funds or any issuer or security in particular. The information presented herein is for illustrative and educational purposes and is not a recommendation, offer or solicitation to buy or sell any securities or to adopt any investment strategy in any jurisdiction where prohibited by law or where contrary to local law or regulation. Any such offer to invest, if made, will only be made to certain qualified investors by means of a private placement memorandum or applicable offering document and in accordance with applicable laws and regulations. Past performance is not indicative of future results, nor should any statements herein be construed as a prediction or guarantee of future results.
Company news
Jun 18, 2025 LaSalle acquires Ruby Stella Hotel in Clerkenwell
The five-building industrial complex was acquired on behalf of the LaSalle Property Fund.
Feb 11, 2025 Kunihiko Okumura and Steve Hyung Kim appointed Asia Pacific leaders
Keith Fujii to assume the role of Chairman of Asia Pacific, with all changes to be effective July 1, 2025.
Make sure you’ve spelled everything correctly, or try searching for something else. If you still can’t find what you’re looking for, you can always Contact us to talk to someone.
LaSalle Investment Management (“LaSalle”) today announced that Brian Klinksiek will join LaSalle as Head of European Research and Global Portfolio Strategies, effective 15 September 2020. Based in London, he will report to Global and Interim Europe CEO Jeff Jacobson, as well as Global Head of Research & Strategy Jacques Gordon.
Mr. Klinksiek will lead LaSalle’s European Research & Strategy team responsible for forecasts of property markets, capital markets and metro economies across the region. Additionally, Mr. Klinksiek will take on a leading role in helping set LaSalle’s global strategy outlook, relative value assessments and portfolio strategies. He will work closely with the firm’s global clients and portfolio managers in developing and implementing comprehensive, integrated global investment strategies. Mr Klinksiek will also lead the expansion and enhancement of LaSalle’s global analytical tools and support the firm’s capital raising and investor relations activities.
Mr. Klinksiek joins LaSalle after spending nearly 17 years in various research and strategy leadership roles at Heitman, with diverse experience across a wide range of markets and property sectors in Europe, North America and Asia. He most recently served as Director of Strategy & Research Operations, based in Hong Kong, focused on global portfolio strategy and developing Heitman’s framework for global portfolio construction. Prior to that, he built and managed a new on-the-ground investment strategy and research capability in Europe for a period of 10 years. Mr. Klinksiek began his career in Heitman’s North America business, focused on research analysis across a wide range of property types and risk categories.
Jeff Jacobson, LaSalle Global CEO, said: “We are delighted to welcome Brian to LaSalle, and look forward to his leadership for this new role. I am confident that his wide-ranging experience and impressive track record will enhance our Research & Strategy platform and offer our clients a unique and sound perspective on European and global investment opportunities.”
Jacques Gordon, Global Head of Research & Strategy for LaSalle, commented: “Today more than ever, investors seek insights that are both tactical and strategic. LaSalle’s approach is to examine long-term secular and structural themes that can affect specific locations and markets when considering buy/hold/sell decisions. Brian’s depth of experience will serve our clients well as we advance through an unprecedented global recession and fragmented recovery.
Brian Klinksiek, Head of European Research and Global Portfolio Strategies for LaSalle added: “I am honoured to be joining LaSalle at a time when both European and global real estate remains a critical allocation for investors. I look forward to building off the impressive foundation and track record LaSalle has established and leveraging my experience to enhance the firm’s investment ideas and capabilities.”
About LaSalle Income & Growth Funds
LaSalle Investment Management is one of the world’s leading real estate investment managers. On a global basis, we manage approximately $77 billion of assets in private equity, debt and public real estate investments as of Q4 2021. The firm sponsors a complete range of investment vehicles including open- and closed-end funds, separate accounts and indirect investments. Our diverse client base includes public and private pension funds, insurance companies, governments, corporations, endowments and private individuals from across the globe. For more information please visit www.lasalle.com and LinkedIn.
NOTE: This information discussed above is based on the market analysis and expectations of LaSalle and should not be relied upon by the reader as research or investment advice regarding LaSalle funds or any issuer or security in particular. The information presented herein is for illustrative and educational purposes and is not a recommendation, offer or solicitation to buy or sell any securities or to adopt any investment strategy in any jurisdiction where prohibited by law or where contrary to local law or regulation. Any such offer to invest, if made, will only be made to certain qualified investors by means of a private placement memorandum or applicable offering document and in accordance with applicable laws and regulations. Past performance is not indicative of future results, nor should any statements herein be construed as a prediction or guarantee of future results.
Company news
Jun 18, 2025 LaSalle acquires Ruby Stella Hotel in Clerkenwell
The five-building industrial complex was acquired on behalf of the LaSalle Property Fund.
Feb 11, 2025 Kunihiko Okumura and Steve Hyung Kim appointed Asia Pacific leaders
Keith Fujii to assume the role of Chairman of Asia Pacific, with all changes to be effective July 1, 2025.
Make sure you’ve spelled everything correctly, or try searching for something else. If you still can’t find what you’re looking for, you can always Contact us to talk to someone.
The outbreak of a new infectious disease, a slowing global economy, ongoing trade negotiations, high asset valuations, and disruptive technology may act as headwinds to favorable real estate performance. At the same time, low-to-zero interest rates, abundant liquidity, rising institutional allocation to real estate, improving real estate market transparency, and more measures for additional monetary and fiscal stimulus among major Asia Pacific – are all tailwinds driving favorable real estate performance in the region, according to LaSalle Investment Management’s Investment Strategy Annual (ISA) 2020. Our market sector recommendations for the Asia Pacific are more targeted for 2020 than prior years. Individual countries within the region may have different responses to these potential headwinds and tailwinds.
Uncertainty remains, as Asia Pacific contends with the trade tensions and exogenous shocks such as the Coronavirus (“CoViD-19”) outbreak. Drawing precise conclusion on the impact of the CoViD-19 outbreak on economic growth and real estate markets is highly speculative at this stage. There is a probability that the short-term impact of CoViD-19 on the Chinese and global economies could be greater than that of SARS, but the rebound/recovery could also be faster than that of SARS. It is still too early to determine and it depends on when CoViD-19 can be contained at a global level.
Nonetheless, there are many reasons for optimism. LaSalle believes that over the next two to three years, decelerating global economic conditions are most likely including in Asia Pacific. However, Asia Pacific is expected to rebound and remain the fastest growing region due to the region’s large population base, fast population growth, rapid urbanization, and its rising middle class. In particular, China remains a key driver of global economic growth over the medium and long term, despite short-term weaknesses.
Real estate, particularly income-generating properties, is favored by investors who are taking a defensive position. Strong liquidity and low-to-zero interest rates are expected to drive the attractiveness of real estate yields in multi-asset portfolios. The attractiveness of real estate is expected to keep prices high in the near term. However, as the economic slowdown weighs on real estate income growth, real estate prices are unlikely to experience substantial run-ups in the near term. In 2020, total returns are expected to decline from the past few years and be primarily driven by occupier fundamentals rather than strong price appreciation. Real estate occupier market supply and demand dynamics are increasingly important going forward.
Jacques Gordon, Global Head of Research and Strategy at LaSalle, said: “After 10 years of unprecedented, steady growth following the Global Financial Crisis, we anticipate that the next few years will bring more headwinds to the world’s real estate markets due to a progressively slowing global economy, ongoing trade and treaty disagreements, divisive domestic politics, high asset valuations and disruptive technology.”
He continues to explain, “However, we do not expect the generally positive current environment to quickly deteriorate due to a mix of macro tailwinds. For instance, low inflation, falling interest rates and balanced fundamentals in most developed countries create ideal conditions for real estate to thrive. And, while technology poses some level of risk, it also allows for more informed decision making and, in many cases, makes properties more attractive to their end users. Even if the potential for a sharp global reversal is unlikely, investors still need to proceed with caution and pay close attention to the macro forces driving each country and the micro-conditions for each specific asset in their portfolios.”
Elysia Tse, Head of Asia Pacific Research and Strategy at LaSalle, said: “This year our market/sector recommendations for the Asia Pacific are more targeted than those in prior years. We continue to favor the Japan real estate market, as current strong real estate market fundamentals in Japan, particularly in Tokyo and Osaka office markets, offer more room to cushion shocks or weaknesses in the near term.”
“We also see areas of relative strength, primarily in the Asia Pacific industrial sector with strong domestic consumption, the need for better designed and equipped facilities to handle the rapid expansion of e-commerce, distribution to major population centers, and rising demand for cold storage facilities to enable more efficient food processing and delivery to consumers.”
About LaSalle Investment Management
LaSalle Investment Management is one of the world’s leading real estate investment managers. On a global basis, we manage approximately $77 billion of assets in private equity, debt and public real estate investments as of Q4 2021. The firm sponsors a complete range of investment vehicles including open- and closed-end funds, separate accounts and indirect investments. Our diverse client base includes public and private pension funds, insurance companies, governments, corporations, endowments and private individuals from across the globe. For more information please visit www.lasalle.com and LinkedIn.
NOTE: This information discussed above is based on the market analysis and expectations of LaSalle and should not be relied upon by the reader as research or investment advice regarding LaSalle funds or any issuer or security in particular. The information presented herein is for illustrative and educational purposes and is not a recommendation, offer or solicitation to buy or sell any securities or to adopt any investment strategy in any jurisdiction where prohibited by law or where contrary to local law or regulation. Any such offer to invest, if made, will only be made to certain qualified investors by means of a private placement memorandum or applicable offering document and in accordance with applicable laws and regulations. Past performance is not indicative of future results, nor should any statements herein be construed as a prediction or guarantee of future results.
Company news
Jun 18, 2025 LaSalle acquires Ruby Stella Hotel in Clerkenwell
The five-building industrial complex was acquired on behalf of the LaSalle Property Fund.
Feb 11, 2025 Kunihiko Okumura and Steve Hyung Kim appointed Asia Pacific leaders
Keith Fujii to assume the role of Chairman of Asia Pacific, with all changes to be effective July 1, 2025.
Make sure you’ve spelled everything correctly, or try searching for something else. If you still can’t find what you’re looking for, you can always Contact us to talk to someone.
LaSalle Investment Management (“LaSalle”), the global real estate investment manager, today announces the appointment of Petra Blazkova as Senior Strategist within its European Research & Strategy team, with responsibility for overseeing Continental European market analysis from the London office.
Petra joins LaSalle from Real Capital Analytics, where she had worked as Senior Director, Asia-Pacific Analytics, since 2015. Prior to that she was based in Singapore as Head of Asia Pacific Capital Markets Research at CBRE, having joined the company in 2011. From 2008 to 2010 she was Head of EMEA Capital Markets Research within the Capital Markets division of JLL, the commercial real estate services firm of which LaSalle is an independent subsidiary, where she executed research to inform the direct and indirect European real estate allocations of leading institutional clients. She previously held research roles focused on the European real estate market at King Sturge (now merged with JLL) and Colliers International.
In her role, Petra will report into the Head of Research and Strategy, Europe.
Jacques Gordon, Global Head of Research & Strategy at LaSalle, says: “Petra is a great addition to our European Research & Strategy team, and we are delighted to welcome her to LaSalle. She brings extensive experience in providing detailed insight into real estate markets and investment trends to a blue-chip client base of institutional investors, fund managers and developers. LaSalle is committed to providing our clients with market-leading analysis that allows them to tailor their real estate allocations and investment strategy to their specific needs and Petra’s appointment will further enhance our proprietary research and coverage of the European market.”
About LaSalle Investment Management
LaSalle Investment Management is one of the world’s leading real estate investment managers. On a global basis, we manage approximately $77 billion of assets in private equity, debt and public real estate investments as of Q4 2021. The firm sponsors a complete range of investment vehicles including open- and closed-end funds, separate accounts and indirect investments. Our diverse client base includes public and private pension funds, insurance companies, governments, corporations, endowments and private individuals from across the globe. For more information please visit www.lasalle.com and LinkedIn.
NOTE: This information discussed above is based on the market analysis and expectations of LaSalle and should not be relied upon by the reader as research or investment advice regarding LaSalle funds or any issuer or security in particular. The information presented herein is for illustrative and educational purposes and is not a recommendation, offer or solicitation to buy or sell any securities or to adopt any investment strategy in any jurisdiction where prohibited by law or where contrary to local law or regulation. Any such offer to invest, if made, will only be made to certain qualified investors by means of a private placement memorandum or applicable offering document and in accordance with applicable laws and regulations. Past performance is not indicative of future results, nor should any statements herein be construed as a prediction or guarantee of future results.
Company news
Jun 18, 2025 LaSalle acquires Ruby Stella Hotel in Clerkenwell
The five-building industrial complex was acquired on behalf of the LaSalle Property Fund.
Feb 11, 2025 Kunihiko Okumura and Steve Hyung Kim appointed Asia Pacific leaders
Keith Fujii to assume the role of Chairman of Asia Pacific, with all changes to be effective July 1, 2025.
Make sure you’ve spelled everything correctly, or try searching for something else. If you still can’t find what you’re looking for, you can always Contact us to talk to someone.
Simon Marx, Investment Strategist, was interviewed by Dani Burger on Bloomberg Daybreak LIVE on Monday morning, discussing findings from the LaSalle E-REGI Index 2019 on European economic growth and the top European cities in which to invest. For 20 years, LaSalle has published its annual European Regional Economic Growth Index – or “E-REGI” – which identifies the European regions and cities with the best growth prospects. The index judges the relative strength of future occupier demand for commercial real estate and proves valuable as the basis of any real estate investment strategy.
About LaSalle Investment Management
LaSalle Investment Management is one of the world’s leading real estate investment managers. On a global basis, we manage approximately $77 billion of assets in private equity, debt and public real estate investments as of Q4 2021. The firm sponsors a complete range of investment vehicles including open- and closed-end funds, separate accounts and indirect investments. Our diverse client base includes public and private pension funds, insurance companies, governments, corporations, endowments and private individuals from across the globe. For more information please visit www.lasalle.com and LinkedIn.
NOTE: This information discussed above is based on the market analysis and expectations of LaSalle and should not be relied upon by the reader as research or investment advice regarding LaSalle funds or any issuer or security in particular. The information presented herein is for illustrative and educational purposes and is not a recommendation, offer or solicitation to buy or sell any securities or to adopt any investment strategy in any jurisdiction where prohibited by law or where contrary to local law or regulation. Any such offer to invest, if made, will only be made to certain qualified investors by means of a private placement memorandum or applicable offering document and in accordance with applicable laws and regulations. Past performance is not indicative of future results, nor should any statements herein be construed as a prediction or guarantee of future results.
Company news
Jun 18, 2025 LaSalle acquires Ruby Stella Hotel in Clerkenwell
The five-building industrial complex was acquired on behalf of the LaSalle Property Fund.
Feb 11, 2025 Kunihiko Okumura and Steve Hyung Kim appointed Asia Pacific leaders
Keith Fujii to assume the role of Chairman of Asia Pacific, with all changes to be effective July 1, 2025.
Make sure you’ve spelled everything correctly, or try searching for something else. If you still can’t find what you’re looking for, you can always Contact us to talk to someone.
London tops Index for 11th time since 2000 Almost all cities in the UK improve in this year’s ranking Manchester overtakes Edinburgh to be the second-highest ranked UK city
For the third year running and the 11th time since 2000, London has retained the top spot on the European Regional Economic Growth Index (“E-REGI”), published today by LaSalle Investment Management (“LaSalle”), the global real estate investment manager. The Index recognises London’s medium-term economic growth prospects as the best in Europe and shows that despite Brexit uncertainty, the UK capital remains the continent’s leading market for future real estate occupier demand.
The E-REGI Index attaches a score to each European region based on its medium-term economic growth prospects, its level of human capital and wealth and the quality of the business environment, relative to the European average. Almost all UK cities improved in the ranking, with Manchester (33rd), Glasgow (51st) and Liverpool (58th) all rising more than 15 spots compared to other cities in Europe. This can be mainly attributed to an improved service employment outlook – for example, in Manchester strong expected employment growth in professional activities and administrative & support service activities has contributed significantly to the city overtaking Edinburgh (34th) as the second-highest ranked UK city.
Despite many of the UK’s cities closing the gap on the capital, London also improved its relative score and even extended its lead on Paris in second place, again primarily due to a more positive service employment outlook compared to last year. The ranking is based on an assumption that the UK will exit the EU with a deal by March 2020 and remain in a customs union with the EU for an extended period. LaSalle recognises that a no-deal Brexit would negatively impact the rankings of the UK’s cities, with London most exposed.
Simon Marx, Director of Research & Strategy at LaSalle said: “Much has changed during the 20-year history of the E-REGI Index, but London has always held a spot close to the top of the Index, despite numerous economic challenges in the past two decades, from the dotcom crash to the global financial crisis. While the outcome of Brexit will clearly have a significant impact on London’s ranking, the city has showed tremendous resilience over the last two decades and remains unparalleled in Europe in terms of the scale, flexibility and diversity of its workforce and skills base.”
He added: “The E-REGI Index identifies the European regions and cities with the best economic growth prospects, which when combined with detailed real estate knowledge, supply-side information and relative pricing has proved to be a valuable tool for portfolio construction, determining real estate market outperformance and investment strategy throughout its 20 year history.”
Other highlights of LaSalle’s 2019 E-REGI Index:
Paris sits in second position for a third consecutive year, experiencing its highest score ever. The French capital leads the LaSalle European Human Capital Index, which drives part of the E-REGI Index score.
Dublin falls into the late cycle category, whereby certain cities have peaked in their economic cycles, and suffers from lower growth prospects over the new forecast period 2019-23. As a result, Dublin fell three places but retained its top 10 status in 9th position.
Amsterdam continued its upward trajectory to reach 16th position, its highest rank since 2006. The large concentration of high value-added sectors adds to the city’s higher-than-average productivity, while the city’s vibrant quality of life attracts foreign talent and tech start-ups, driving competitiveness further.
Nordic cities continue to feature in the top-end of the ranking due to strong human capital and wealth scores, with three in the top ten (Stockholm, Oslo and Copenhagen-Malmö).
Istanbul replaces Stockholm in third place thanks to strong GDP and employment scores, and it has also seen a large improvement in its employment growth prospects and human capital.
German cities were generally slightly weaker in the Index as a struggling industrial sector amid weak global trade and elevated uncertainty weakened the country’s economic overall outlook, with only Munich (5th) remaining in the top 10.
Of all European cities, Bucharest, a popular IT outsourcing location, and Moscow, whose employment prospects have been boosted by pension reform, made the most progress in the ranking this year, jumping to 45th (+40) and 49th (+48) respectively.
Looking ahead, there are also factors which are not currently captured by the E-REGI Index and that are becoming increasingly important to the success and ultimately real estate performance of cities. Factors such as sustainability, urban density, liveability and wellbeing, climate change resilience and accessibility are becoming increasingly important and data availability enabling the measurement and comparability of these factors across geographies is improving. Looking ahead at the next 20 years the E-REGI Index will attempt to systematically capture features such as environmental quality including air quality, housing affordability, the quality of transport, the quality of social infrastructure, the presence of innovation industries and the widespread lack of mixed-use assets.
About LaSalle Investment Management
LaSalle Investment Management is one of the world’s leading real estate investment managers. On a global basis, we manage approximately $77 billion of assets in private equity, debt and public real estate investments as of Q4 2021. The firm sponsors a complete range of investment vehicles including open- and closed-end funds, separate accounts and indirect investments. Our diverse client base includes public and private pension funds, insurance companies, governments, corporations, endowments and private individuals from across the globe. For more information please visit www.lasalle.com and LinkedIn.
NOTE: This information discussed above is based on the market analysis and expectations of LaSalle and should not be relied upon by the reader as research or investment advice regarding LaSalle funds or any issuer or security in particular. The information presented herein is for illustrative and educational purposes and is not a recommendation, offer or solicitation to buy or sell any securities or to adopt any investment strategy in any jurisdiction where prohibited by law or where contrary to local law or regulation. Any such offer to invest, if made, will only be made to certain qualified investors by means of a private placement memorandum or applicable offering document and in accordance with applicable laws and regulations. Past performance is not indicative of future results, nor should any statements herein be construed as a prediction or guarantee of future results.
Company news
Jun 18, 2025 LaSalle acquires Ruby Stella Hotel in Clerkenwell
The five-building industrial complex was acquired on behalf of the LaSalle Property Fund.
Feb 11, 2025 Kunihiko Okumura and Steve Hyung Kim appointed Asia Pacific leaders
Keith Fujii to assume the role of Chairman of Asia Pacific, with all changes to be effective July 1, 2025.
Make sure you’ve spelled everything correctly, or try searching for something else. If you still can’t find what you’re looking for, you can always Contact us to talk to someone.
LaSalle Investment Management (LaSalle) has published the Mid-Year update for the 2019 Investment Strategy Annual. Under a slow growth, low inflation, and low interest rate environment, LaSalle’s regional real estate strategy focuses on sectors, markets and locations where domestic consumption growth supports real estate demand. This press release focuses on the Asia Pacific regional outlook.
LaSalle expects a weaker macro environment in the next 6-12 months than the past few years, partly due to the U.S.-China trade war and the maturing global economic cycle. However, a financial crisis or a regional recession is not in LaSalle’s base case. Japan is likely to be more resilient than other major Asia Pacific countries. China is expected to experience some short-term weaknesses but remains positive on the mid to long-term as the country has multiple monetary and fiscal tools to offset the negative impact from the trade war. Since market outlook has shifted to monetary easing, capital market liquidity is expected to remain high in the region, barring any external disruption.
Elysia Tse, Head of Asia Pacific Research and Strategy at LaSalle says: “Although capital market volatility is increasing, real estate investors are likely to continue to invest but at a slower pace with discipline. For core strategies, investors will need to focus on areas with relative resiliency and protecting the durability of cash flows. For higher-return strategies, investors are likely to seek real estate segments and locations that could outgrow the broad economy. The focus of higher-return strategies is shifting from maximizing returns to narrowing the dispersion of return outcomes.”
“The focuses on asset management will be maintaining flexibility on holding periods and asset-level business plans, and identifying early lease renewals or early exits opportunities. The focuses for new acquisitions will be the location and each asset’s strength that matches stringent underwriting criteria.”
Property Sector insights in Asia Pacific:
Office: Office market performance is expected to continue to diverge in the region. We recommend being highly selective on submarkets, location and asset quality.
Logistics: We continue to favor the logistics sector in the region. We anticipate high development yields in China and South Korea. Not only is logistics demand supported by domestic consumption and the growth of e-commerce, but logistics rents are generally less volatile than those of offices.
Retail: We are cautious of the overall retail sector. However, selective retail properties in Japan and Singapore are expected to be less impacted by e-commerce than South Korea.
Hotel: Asian tourist demand is another strength for the region. Location selection is critical, as well as identifying the hotel segment that match tourist profile.
About LaSalle Investment Management
LaSalle Investment Management is one of the world’s leading real estate investment managers. On a global basis, we manage approximately $77 billion of assets in private equity, debt and public real estate investments as of Q4 2021. The firm sponsors a complete range of investment vehicles including open- and closed-end funds, separate accounts and indirect investments. Our diverse client base includes public and private pension funds, insurance companies, governments, corporations, endowments and private individuals from across the globe. For more information please visit www.lasalle.com and LinkedIn.
NOTE: This information discussed above is based on the market analysis and expectations of LaSalle and should not be relied upon by the reader as research or investment advice regarding LaSalle funds or any issuer or security in particular. The information presented herein is for illustrative and educational purposes and is not a recommendation, offer or solicitation to buy or sell any securities or to adopt any investment strategy in any jurisdiction where prohibited by law or where contrary to local law or regulation. Any such offer to invest, if made, will only be made to certain qualified investors by means of a private placement memorandum or applicable offering document and in accordance with applicable laws and regulations. Past performance is not indicative of future results, nor should any statements herein be construed as a prediction or guarantee of future results.
Company news
Jun 18, 2025 LaSalle acquires Ruby Stella Hotel in Clerkenwell
The five-building industrial complex was acquired on behalf of the LaSalle Property Fund.
Feb 11, 2025 Kunihiko Okumura and Steve Hyung Kim appointed Asia Pacific leaders
Keith Fujii to assume the role of Chairman of Asia Pacific, with all changes to be effective July 1, 2025.
Make sure you’ve spelled everything correctly, or try searching for something else. If you still can’t find what you’re looking for, you can always Contact us to talk to someone.
LaSalle Investment Management (“LaSalle”) today published the findings of a comprehensive survey that examines how sustainability concerns factor into institutional real estate investors’ decisions. The survey was administered by Private Equity Real Estate (“PERE”), to 60 institutional investors between March and June 2019. While the majority of respondents confirm that sustainability plays a role in their investment decision making, the findings reflect clear regional differences in sustainability attitudes.
On a global level, more than one-third of respondents expressed that sustainability plays a major role in their capital allocation decisions. Europe continues to build upon its track record for being the most sustainable-focused region, with 45 percent of respondents admitting that sustainability plays a major role in their investment decisions. Conversely, in North America, nearly one-third of respondents consider sustainability principles a factor of secondary or tertiary importance, while 25 percent of respondents assert that it plays a major role. Asia-Pacific respondents demonstrated mixed feelings about sustainability policy, displaying a nearly balanced sentiment.
Eric Duchon, Global Head of Sustainability at LaSalle, commented, “This report shows that sustainability is not simply a buzzword or passing trend. sustainability initiatives have become more central to real estate investment strategies, and these policies are increasingly driving institutional investors’ decisions. We believe that it is essential for investment managers to have a well-constructed and properly implemented sustainability policy in place in order to raise capital. While some of the geographic and sector-specific disparities uncovered in the report demonstrate that there is still much work to be done, the bottom line is that sustainability is no longer a ‘nice-to-have.’ It is a moral imperative and fiduciary duty for private investment managers.”
Reflecting an increased focus on sustainability factors, 70 percent of the survey’s respondents professed to having an explicit sustainability policy in place while 86 percent deemed it important for managers to evidence a clear sustainability policy at due diligence. Interestingly, however, many respondents admit that it is difficult to correlate a manager’s sustainability policy to actual investment returns. In fact, only 6 percent find this an easy exercise, while 45 percent do not bother with this analysis at all. These findings suggest that more needs to be done to develop a clear methodology that allows investors to assess the value sustainability delivers to the bottom line.
The survey also found disparity toward sustainability commitment relating to different real estate sectors. For instance, investments into office space have made the greatest strides, with 80 percent of respondents reporting moderate or significant progress. On the other hand, 48 percent of respondents have experienced little or no progress with retail investments. Importantly, investors are optimistic about the value versus cost of sustainability policy implementation: 43 percent believe the value of sustainability is greater than the cost of implementation, with a further 12 percent stating that the value is on par. Just 6 percent of investors consider the cost of implementation to outweigh the value.
About LaSalle Investment Management
LaSalle Investment Management is one of the world’s leading real estate investment managers. On a global basis, we manage approximately $77 billion of assets in private equity, debt and public real estate investments as of Q4 2021. The firm sponsors a complete range of investment vehicles including open- and closed-end funds, separate accounts and indirect investments. Our diverse client base includes public and private pension funds, insurance companies, governments, corporations, endowments and private individuals from across the globe. For more information please visit www.lasalle.com and LinkedIn.
NOTE: This information discussed above is based on the market analysis and expectations of LaSalle and should not be relied upon by the reader as research or investment advice regarding LaSalle funds or any issuer or security in particular. The information presented herein is for illustrative and educational purposes and is not a recommendation, offer or solicitation to buy or sell any securities or to adopt any investment strategy in any jurisdiction where prohibited by law or where contrary to local law or regulation. Any such offer to invest, if made, will only be made to certain qualified investors by means of a private placement memorandum or applicable offering document and in accordance with applicable laws and regulations. Past performance is not indicative of future results, nor should any statements herein be construed as a prediction or guarantee of future results.
Company news
Jun 18, 2025 LaSalle acquires Ruby Stella Hotel in Clerkenwell
The five-building industrial complex was acquired on behalf of the LaSalle Property Fund.
Feb 11, 2025 Kunihiko Okumura and Steve Hyung Kim appointed Asia Pacific leaders
Keith Fujii to assume the role of Chairman of Asia Pacific, with all changes to be effective July 1, 2025.
Make sure you’ve spelled everything correctly, or try searching for something else. If you still can’t find what you’re looking for, you can always Contact us to talk to someone.
According to LaSalle Investment Management’s Investment Strategy Annual (ISA) 2019, the fundamental drivers of real estate occupier markets are likely to retain their “just right” status in 2019. However, investors should expect an eventual cyclical inflection, and watch for signs of late-cycle excesses and risk taking. In 2019, investors are expected to make investment decisions in an environment of rising volatility and uncertainty. If a recession comes, leased real estate will not be immune, but it will be a “low beta”, or less sensitive financial asset.
Jacques Gordon, Global Strategist for LaSalle, said: “In order to mitigate these potential risks, the construction of real estate portfolios that employ defensive (low beta) positioning while still dedicating a portion of investment to higher (alpha-seeking) return strategies is recommended in LaSalle’s ISA 2019.”
In Asia Pacific, investors face macro risks including the U.S.-China trade war and China’s ability to sustain economic growth. However, the latter is tempered by China’s capability to introduce monetary, fiscal and regulatory stimuli, and strengthen its trade relations with the rest of the world, particularly within trade partners in Asia Pacific to offset the negative impact of trade tariffs should the trade war escalate.
As noted in LaSalle’s ISA 2019, global economic growth is cooling. With most Asia Pacific countries at the mature stage of the economic cycle, investors also should expect the region’s pace of economic growth in 2019-2020 to be below the 2017-2018 peak levels, giving rise to some risk of investor sentiment vulnerability in the capital markets. Nevertheless, labor markets in major Asia Pacific economies are healthy. Bank, corporate and household balance sheets are generally healthier than the pre-Global Financial Crisis (“pre-GFC”) period, with a few exceptions. All of the above puts the region in a good position to handle an economic slowdown if one occurs. If a recession comes to any of the major APAC economies, LaSalle believes it will be at a much lower risk level than during the GFC.
Major central banks globally are now walking on a tightrope between loose and tight monetary policies. Key messages from major central banks suggest that rate hikes are now on the back burner, as concerns over economic slowdown or recession risks rise. As a result, the risk of rising interest rates substantially pushing up capitalization rates and reducing real estate values is low. Most importantly, Asia Pacific real estate occupier and capital markets are generally more correlated with their respective domestic macroeconomic environments than with external shocks. Rental growth in most major Asia Pacific markets in 2019–21 is expected to remain positive and mostly at or slightly below their historical averages.
Over the long term, the region is poised to grow faster than other parts of the world as it transitions from an export-led region to one based more on domestic consumption, intraregional trade and tourism, urbanization and steady rise of the middle class population. The commercial real estate markets in the region are expected to remain attractive, as the region’s large and strong domestic demand base and the relatively high growth prospects by global standards are expected to continue to attract occupiers and investors alike.
Elysia Tse, Head of Asia Pacific Research and Strategy at LaSalle, said: “Supply-demand dynamics are largely healthy in major Asia Pacific real estate markets. Nonetheless, investors should expect lower returns in 2019 than in the past few years and some divergence in strong versus weak markets/sectors and primary versus secondary asset quality. As volatility increases, quality assets and flexibility become more important. Holding period and floor plan flexibility, early loan extensions, or early lease renewals all represent the optionalities needed to survive a downturn. Most importantly, preserve some capital, when possible. Be ready to take advantage of dislocation, should it occur in the real estate sector.”
Real Estate Opportunities and Investment Themes in Asia Pacific
Industrial: The outlook for the industrial sector in Asia Pacific remains favorable as demand is supported by domestic consumption and the growth of e-commerce, which is stronger than the projected GDP growth. However, supply is generally increasing in Asia Pacific markets, which requires close local-level monitoring. Market yields for logistics remain much higher than those of office properties, although they have compressed. For low risk investors, LaSalle favors logistics properties with credit tenant leases. The attractive development yield spreads are also supportive of development or build-to-core strategies, particularly in China Tier 1 cities and their satellite cities, select China Tier 2 cities, as well as the greater Seoul area. For these higher return strategies, submarket and site selection are increasingly important to manage the supply risk.
Cold storage is also an emerging and fast-growing segment in the industrial sector, whilst cold warehousing is still at an early stage of institutionalization. The location of cold storage warehouses is more important than for “dry” warehouses. LaSalle favors well-located cold storage warehouses for higher return strategies, but only when investors have a well-defined exit plan and experienced asset management capability to assist in the execution of asset-level business plans.
Office: While pricing and capital market demand for major Asia Pacific office markets are near peak levels, office occupier markets in Asia Pacific are at different stages of the occupier market cycle. Technology companies and co-working operators are boosting demand and reducing vacancy rates in major Asia Pacific office markets (e.g., Sydney, Shanghai, and Tokyo). The inflexibility of the traditional office leasing model sometimes does not align with the dynamic growth that many different firms — both large and small — are expecting, and LaSalle sees the co-working model likely to become a permanent option in major office markets across Asia Pacific. However, the performance of co-working operators has not been tested in a downturn. LaSalle recommends limiting the proportion of co-working and technology tenants to be a minority of an office portfolio (with variations at the asset level), and to focus on tenant credit and covenants for the majority of a property portfolio.
Retail: Investor sentiment for the retail sector is generally weaker than that of the industrial and office sectors. Domestic retail demand is expected to be more resilient in the region, while the tourist trade could be more volatile, although it remains a fast-growing segment in many gateway cities. E-commerce is contributing to the divergence between dominant, better-located and better-configured retail centers and inferior locations and outdated centers. However, in select markets, retail centers are also benefiting from online retailers who are extending their fast-growing on-line distribution channels to include brick-and-mortar stores. LaSalle is highly selective in the retail sector, with a tilt towards non-discretionary retail centers with a high tenant mix in grocery, pharmacy, food and beverage, and services located in strong residential catchment areas, particularly in Japan, Singapore, Hong Kong, and Tier 1 cities in China for core or value-add to core strategies.
Residential: Record or cyclically high residential prices in the region and the changing lifestyles of young households are driving the regeneration of multifamily markets, particularly in urban neighborhoods. For core investors, LaSalle favors urban rental apartments in Japan with excellent access to workplaces and amenities.
The for-sale residential market in Australia is particularly at risk with early signs of home price softening. Household debt in Australia is one of the highest in the region. When coupled with rising borrowing costs and tighter bank lending, home prices could correct further, particularly in the condo segment where supply is still at a record high. In Hong Kong, home prices have tripled since December 2008. LaSalle expects residential prices in Hong Kong to adjust moderately in the near term, but much less severe than the correction in 1997-98. For investors who can tolerate higher risk, LaSalle recommends monitoring the for-sale residential sectors in Australia for potential entry opportunities, if residential and land prices are adjusted.
Hotel: Asian tourists, particularly the Chinese, are the key demand drivers of Asia Pacific hotels — particularly in Australia, Hong Kong, Japan, South Korea and Singapore. Depreciation of the Chinese yuan is unlikely to deter Chinese outbound travel to other major Asia Pacific tourist destinations. Investors with high risk tolerance could target hotel refurbishment opportunities near major tourist attractions, focusing on location selection and identifying the hotel segment that has a mismatch of demand and supply.
About LaSalle Investment Management
LaSalle Investment Management is one of the world’s leading real estate investment managers. On a global basis, we manage approximately $77 billion of assets in private equity, debt and public real estate investments as of Q4 2021. The firm sponsors a complete range of investment vehicles including open- and closed-end funds, separate accounts and indirect investments. Our diverse client base includes public and private pension funds, insurance companies, governments, corporations, endowments and private individuals from across the globe. For more information please visit www.lasalle.com and LinkedIn.
NOTE: This information discussed above is based on the market analysis and expectations of LaSalle and should not be relied upon by the reader as research or investment advice regarding LaSalle funds or any issuer or security in particular. The information presented herein is for illustrative and educational purposes and is not a recommendation, offer or solicitation to buy or sell any securities or to adopt any investment strategy in any jurisdiction where prohibited by law or where contrary to local law or regulation. Any such offer to invest, if made, will only be made to certain qualified investors by means of a private placement memorandum or applicable offering document and in accordance with applicable laws and regulations. Past performance is not indicative of future results, nor should any statements herein be construed as a prediction or guarantee of future results.
Company news
Jun 18, 2025 LaSalle acquires Ruby Stella Hotel in Clerkenwell
The five-building industrial complex was acquired on behalf of the LaSalle Property Fund.
Feb 11, 2025 Kunihiko Okumura and Steve Hyung Kim appointed Asia Pacific leaders
Keith Fujii to assume the role of Chairman of Asia Pacific, with all changes to be effective July 1, 2025.
Make sure you’ve spelled everything correctly, or try searching for something else. If you still can’t find what you’re looking for, you can always Contact us to talk to someone.


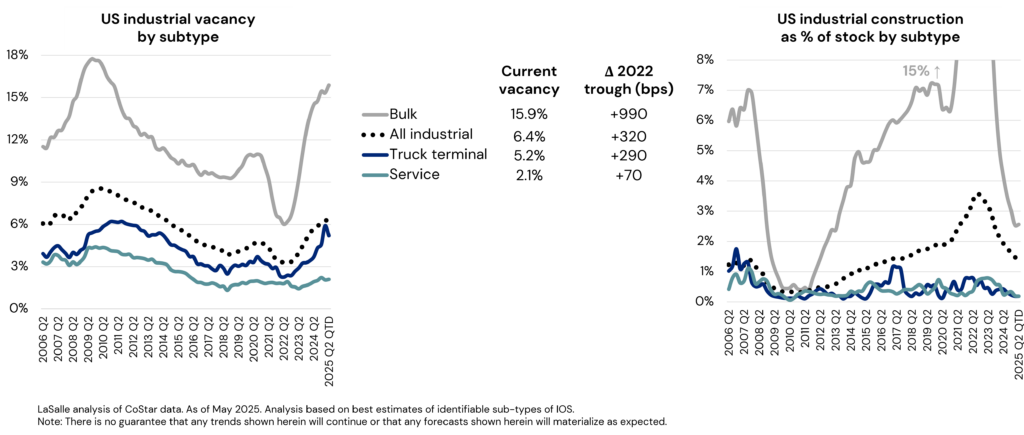

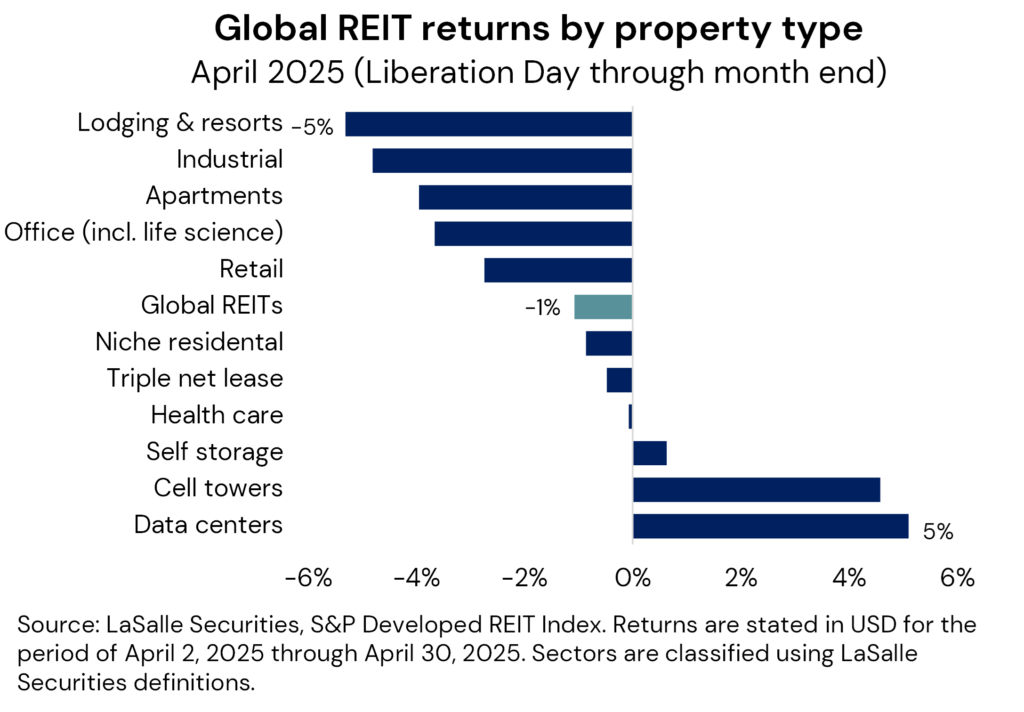
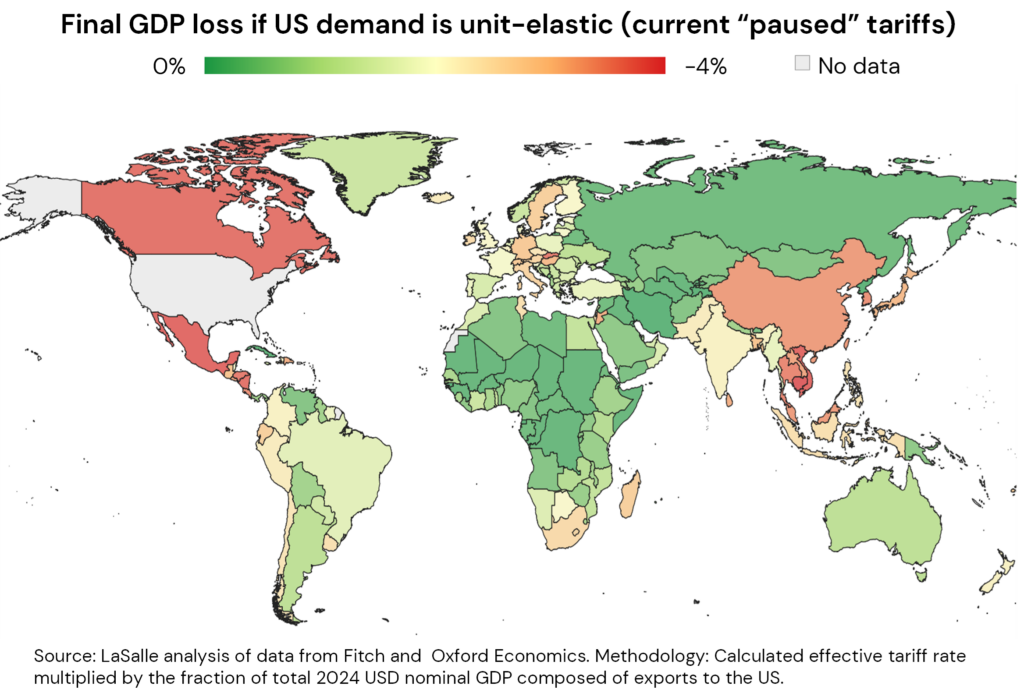
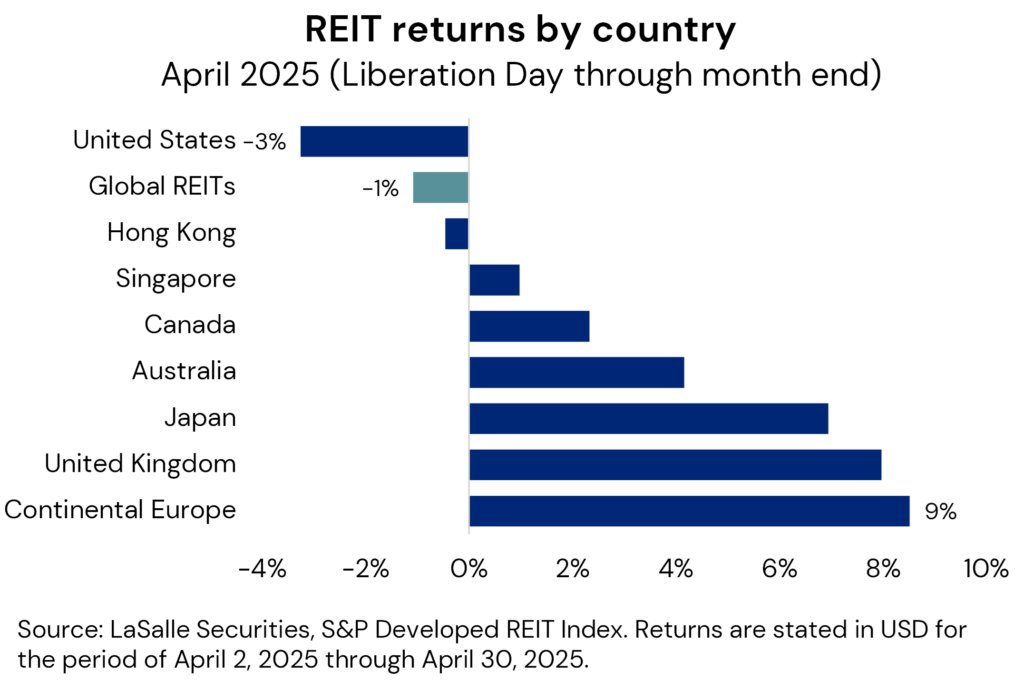


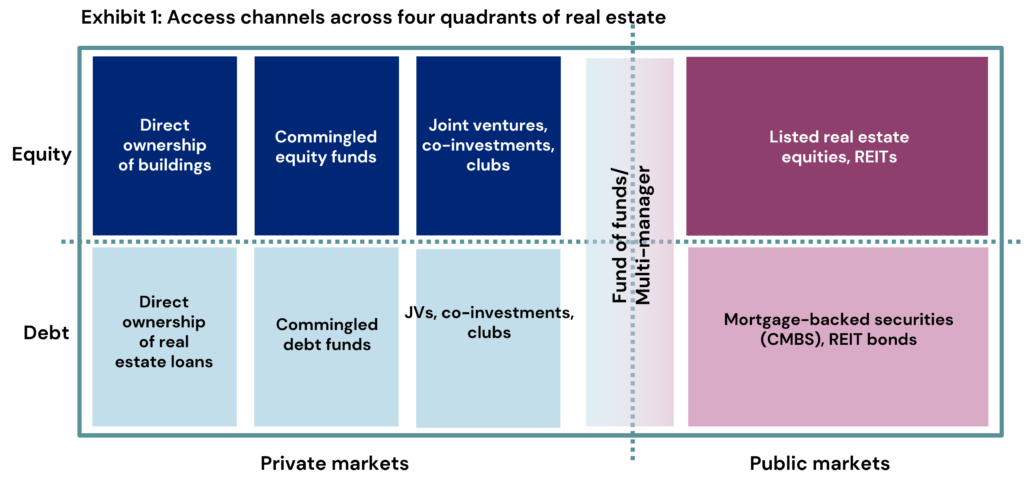


 Why real estate lays out the case for property exposure in a multi-asset context?
  Why global considers the benefits of expanding horizons beyond an investor’s domestic market?
  Why be sector smart tries to make sense of the recent changes in relative sector performance with an eye to building resilient portfolios?
  Why be quadrant smart addresses the interplay among the “four quadrants” of real estate?
  Why manage risk explores the importance of—and our approach to—managing investment risk?