

-
(L-R) LaSalle’s Brian Klinksiek, Elysia Tse, Fred Tang and Wayne Qin We have been fielding questions on two big macroeconomic topics impacting the Asia-Pacific region: (1) the outlook for China’s economic recovery and (2) the path of the Bank of Japan’s monetary policy. These involve legitimate worries about China’s growth engine and the risk of interest rate hikes in Japan. Nonetheless, we find that media coverage of these topics can sometimes sensationalize their implications without going below the surface.
In this ISA Briefing, and the accompanying LaSalle Macro Quarterly (LMQ), we dissect these concerns and share our views on several frequently asked questions. Our analysis points to a nuanced picture that is more supportive of investments in these two countries than the media coverage might suggest.
China’s economic recovery
China’s economic recovery has been slower than in past cycles, as we anticipated in our ISA Briefing from early March (China’s Great Reopening). While exports and for-sale residential investment have been sluggish, domestic consumption, industrial output, manufacturing and infrastructure investment continue to support the economy (see the chart below). The for-sale residential market could bottom in the next 6-12 months as demand-supply dynamics gradually improve. Unlike previous downturns, the government has not announced a blast of mega monetary or fiscal stimulus. This conservative approach could help ensure a sustainable long-term growth environment for the Chinese economy without unintentionally creating new imbalances.We expect economic activity in China to continue to recover through 2024. Various supportive economic measures designed to boost business and consumer confidence were rolled out after the Politburo meeting on July 24; however, it takes time for stimulus measures to take effect. We continue to expect a modest recovery in China this year, likely close to the 5% GDP growth target. But oft-cited concerns over the Chinese economy such as the weak for-sale residential sector, the defaults of highly leveraged real estate developers, high youth unemployment and deflationary pressures deserve to be addressed, as we do in this FAQ.
GDP growth and key economic indicators in China in Q2 2023
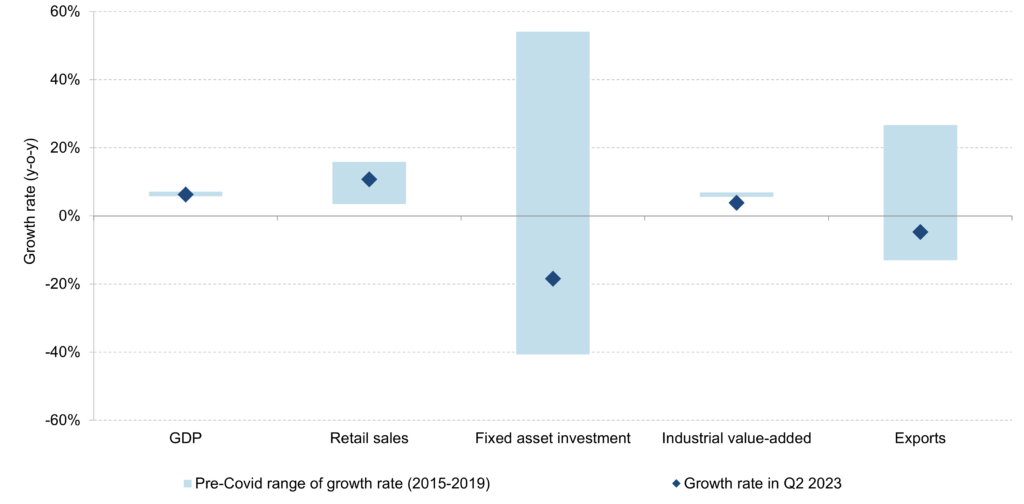
Note: The growth rate of industrial value-added is the y-o-y growth rate of the YTD data. The growth rates of other indicators are the y-o-y growth rates of quarterly data. The historical ranges of the indicators are based on historical y-o-y growth rates in the 20 quarters in 2015-2019.Sources: The National Bureau of Statistics of China (GDP growth, retail sales volume, fixed asset investment growth, and industrial value-add growth), as of Q2 2023; General Administration of Customs (export growth), as of Q2 2023; LaSalle Investment Management (retail sales growth), as of Q2 2023.
Q: How concerning is the outlook for China’s housing market?
A: The for-sale residential sector is stabilizing in the largest cities.
Despite short-term volatility in sales volume and prices, China’s for-sale residential sector is experiencing a slowing decline in sales volumes and prices compared to the second half of 2022. In Tier 1 cities, however, both sales volume and prices are already improving [LMQ page 24]. In the next 6-12 months, the overall for-sale residential market could reach bottom, supported by government policies, a decline in supply and a reduction in mortgage rates and down payments. We expect the subsequent recovery to be gradual. For-sale residential prices may improve, though sales volumes are unlikely to recover to their prior peak. We expect housing markets in Tier 1 and top Tier 2 cities to lead the recovery of low-tier cities.
Q: What about the troubled developers?
A: Highly leveraged developers are likely to have only a marginal impact on the Chinese financial system.
Despite our expectation of an eventual recovery in China’s for-sale residential sector, the outlook for over-leveraged developers with large exposures to low-tier cities, including Evergrande and Country Garden, remains gloomy. The resolution of these developers’ onshore and offshore corporate debt is expected to take time, which will continue to draw media attention. However, the impact of the default or bankruptcy of these troubled residential developers on the Chinese financial system has been limited so far, and we expect it to remain so, given the exposure of Chinese commercial banks to real estate construction loans only accounted for ~4% of their total assets as of the second quarter of 2023.1 Even for the more vulnerable trust companies, the exposure to real estate declined from ~13% of their total assets in the second quarter of 2019 to ~5% in the second quarter of 2023.2
Q: What is the story with rising youth unemployment?A: The high youth unemployment rate is misleading.
The unemployment rate of the labor force aged 16-24 in China is rising. However, the direct impacts of this on retail sales and the broader economy are likely to be limited. Those aged 16-24 accounted for only around ten percent of the Chinese population as of 2021.3 In addition, many of those aged 16-24 are still in school, given that young people in China finish education at around age 20, on average.4 There could be some indirect impacts of high youth unemployment on household confidence, although we do not expect them to be significant given that the unemployment rate for the key labor force in China (aged 25-59) is at its lowest level since 2018 [LMQ page 25].Q: Is China at risk of deflation?
A: It is premature to make the call that China is entering a deflationary period.
It is true that China’s headline inflation rates have been fluctuating around 0% in recent months, primarily driven by food and energy prices coming off peak levels post lockdowns. However, the core inflation rate (excluding food and energy) remains in positive territory [LMQ page 16]. As the Chinese economy gradually recovers and the post-lockdown effects fade, we expect inflation to gradually escalate.Looking ahead
- Western commentators have generally been disappointed at China’s lack of bazooka stimulus to reinvigorate the economy. The Chinese government’s approach has been to instead focus on smaller stimulus measures or targeted policy shifts. We believe that even if all these supportive actions fail, China still has many options it can implement to boost the economy. In our view, there is a high probability that the Chinese economy could reach its 5% GDP growth target by the end of the year.
- China’s mild economic recovery and slowly improving business and household confidence suggest the demand recovery for income-producing real estate in China could be modest in the near term. Net absorption of major sectors including office, logistics, retail and rented multifamily in the next 12-18 months is likely to be below the levels seen in 2021.
- Troubled for-sale residential developers may continue to offload assets to repair their balance sheets. Over the past decade, Chinese developers have built large portfolios of commercial real estate, mainly composed of offices, retail malls, and hotels. A small number of these developers also own assets in our favored sectors, such as multifamily rental and logistics. Distressed sales at attractive prices could continue to surface in the next 6-12 months.
The path of Japanese monetary policy
The Bank of Japan (BoJ) remains an outlier among global central banks, as it continues to maintain ultra-accommodative policy in the form of yield curve control (YCC). The BoJ introduced YCC in 2016, with the intent to keep 10-year government bond yields low to stimulate consumer spending and business investment. Over the past year, speculation has mounted as to whether this policy would be sustained, with volatility being triggered around moments of policy adjustments or speculation that YCC would be abandoned.Most recently, on September 22, the BoJ kept the YCC policy unchanged with a unanimous vote. The 3-month rates used a reference for borrowing costs have been bouncing around -0.2 to -0.1%, while the 10-year Japanese government bond (JGB) yields have increased to 0.73% since the BoJ’s surprise tweak to the YCC in December last year [LMQ page 7].5 Inflation in Japan has been running above the BoJ’s two percent target over the past 17 months,6 which in theory could be a catalyst for the BoJ to make more tweaks to its YCC policy or even exit it in the near term. But the answers to complex questions about the trajectory of rates in Japan aren’t so simple; policy actions and capital market reactions are inherently difficult to predict, but are likely to be less dramatic than feared.
Q: Isn’t the BoJ under pressure to change policy to tackle above-target inflation?
A: The two percent inflation target is likely to be achieved in the short term, but the BoJ is focusing on whether the target can be achieved sustainably.
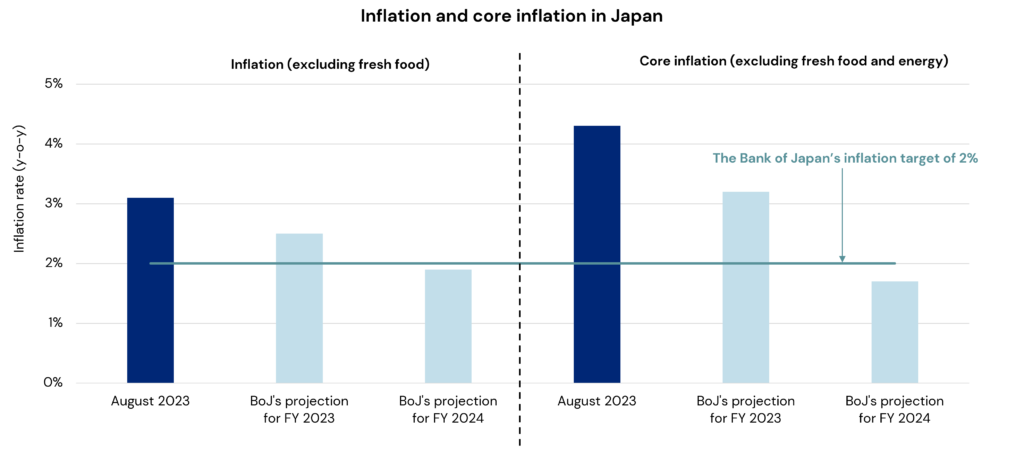
The latest BoJ inflation projections and Tankan survey results7 suggest that inflation could remain above the BoJ’s 2% target at least over the next 12 months [LMQ page 19]. Wages in Japan, a key component of inflation, grew by 2.3% y-o-y in July 2023 due to a tight labor market.8 Employment conditions are expected to tighten further in the near term,9 potentially reaching levels last seen in 1990s. The 2024 Shunto (spring) wage negotiation is the next key event to monitor. Hence, it is as yet uncertain whether wage growth in Japan could remain consistently above its 2% target.Inflation and core inflation in Japan

Source: The Japan Statistics Bureau (historical inflation data), as of August 2023. The Bank of Japan (inflation projection for fiscal year 2023 and 2024), as of July 2023.
Inflationary pressures do not exist in a national vacuum. Thankfully, inflation is now declining in other developed markets [LMQ page 12], potentially giving the BoJ more time to evaluate the prospects for inflation in Japan. Many central banks, following the lead of the US Federal Reserve, are seen to be at or near the end of their tightening cycles as inflationary pressure tapers. That said, global central banks are highly unlikely to cut interest rates sharply any time soon, unless economies fall into deep recession. Therefore, we expect the interest rate differential between Japan and the US to remain wide but may narrow somewhat in the near term. Moderation in the interest rate differential could help the weak yen to regain some ground, which might also alleviate some pressure on the BoJ.
Q: How do you read the political tea leaves around BoJ’s policy?
A: Policymakers will tread carefully as they do not want to upset the labor market and the financial system.
Inflation in Japan has been outpacing wage growth, putting pressure on Prime Minister Fumio Kishida’s approval ratings, according to a poll conducted by the Asahi Shimbun newspaper on September 18. There is a strong political impetus for Kishida and the new cabinet to ensure wage growth consistently exceeds the inflation rate. Moreover, as more than 70% of the mortgage loans in Japan have floating rates,10 there is a strong incentive for the BoJ to keep short-term interest rates relatively low. BoJ measures that could derail Japan’s economic recovery or disrupt the capital markets could be considered politically risky and thus less likely.Looking ahead
- Forward markets indicate that 3-month interest rates are expected to enter positive territory but remain below 0.2% over the next two years, which implies that borrowing costs in Japan would remain much lower than those of other developed economies. Leveraged real estate yields in Japan remain higher than unlevered yields, in contrast to many other markets where real estate debt is now priced at levels that lead to “negative leverage” at today’s pricing. Japanese real estate debt costs could remain relatively low if the forward markets’ prediction is accurate.
- Yields on 10-year JGBs have increased sharply by Japan’s historical standards since the BoJ loosened the YCC in December 2022. The forward markets imply that 10-year JGB yields could increase to close to 1.1% by September 2025, near the level last seen in the second half of 2011. Such an increase would be modest by global comparison but could be viewed as a step closer to interest rate normalization. Given “the math” of rate rises when the starting point is low in absolute terms, even a modest increase in 10-year JGB yields could have some impact on Japanese real estate valuations, a risk that investors should anticipate and plan for accordingly.
- Nonetheless, there are still wide gaps between JGB yields, current yields on other asset classes and real estate yields. This makes income-producing Japanese real estate investments attractive, especially for domestic investors, who dominate the market. With a uniquely wide positive spread between borrowing costs and cap rates, we expect Japan to continue to remain the most liquid institutional real estate market in Asia-Pacific for the foreseeable future, albeit with some volatility at times.
Footnotes1 Source: The People’s Bank of China (total amount of outstanding real estate construction loans), as of Q2 2023; State Administration of Financial Supervision and Administration of China (total assets of commercial banks), as of Q2 2023
2 Source: The China Trustee Association, as of Q2 2023
3 Source: The National Bureau of Statistics of China, as of 2021
4 Source: LaSalle Investment Management, as of 2021. The estimation is based on the average years of education among the young labor force in China published by the Ministry of Education of China in 2021.
5 Source: Bloomberg, as of September 25, 2023
6 Source: The Japan Statistics Bureau, as of August 2023
7 Source: The Bank of Japan’s Tankan survey on the inflation expectation and the output price expectation among corporates of all industries, as of June 2023
8 Source: The Japan Statistics Bureau, as of August 2023
9 The Bank of Japan’s Tankan survey: all-industry employment conditions, as of June 2023
10 Source: The Japan Housing Finance Agency, covering home loans between October 2022 and March 2023.
Important Notice and DisclaimerThis publication does not constitute an offer to sell, or the solicitation of an offer to buy, any securities or any interests in any investment products advised by, or the advisory services of, LaSalle Investment Management (together with its global investment advisory affiliates, “LaSalle”). This publication has been prepared without regard to the specific investment objectives, financial situation or particular needs of recipients and under no circumstances is this publication on its own intended to be, or serve as, investment advice. The discussions set forth in this publication are intended for informational purposes only, do not constitute investment advice and are subject to correction, completion and amendment without notice. Further, nothing herein constitutes legal or tax advice. Prior to making any investment, an investor should consult with its own investment, accounting, legal and tax advisers to independently evaluate the risks, consequences and suitability of that investment.
LaSalle has taken reasonable care to ensure that the information contained in this publication is accurate and has been obtained from reliable sources. Any opinions, forecasts, projections or other statements that are made in this publication are forward-looking statements. Although LaSalle believes that the expectations reflected in such forward-looking statements are reasonable, they do involve a number of assumptions, risks and uncertainties. Accordingly, LaSalle does not make any express or implied representation or warranty, and no responsibility is accepted with respect to the adequacy, accuracy, completeness or reasonableness of the facts, opinions, estimates, forecasts, or other information set out in this publication or any further information, written or oral notice, or other document at any time supplied in connection with this publication. LaSalle does not undertake and is under no obligation to update or keep current the information or content contained in this publication for future events. LaSalle does not accept any liability in negligence or otherwise for any loss or damage suffered by any party resulting from reliance on this publication and nothing contained herein shall be relied upon as a promise or guarantee regarding any future events or performance.
By accepting receipt of this publication, the recipient agrees not to distribute, offer or sell this publication or copies of it and agrees not to make use of the publication other than for its own general information purposes.
Copyright © LaSalle Investment Management 2023. All rights reserved. No part of this document may be reproduced by any means, whether graphically, electronically, mechanically or otherwise howsoever, including without limitation photocopying and recording on magnetic tape, or included in any information store and/or retrieval system without prior written permission of LaSalle Investment Management.

Jul 23, 2024
ISA Focus: Investing in real estate debt
LaSalle’s Research and Strategy team examines the place for private real estate credit in institutional portfolios.

