

-
(L-R) LaSalle’s Brian Klinksiek, Matthew Wapelhorst and Frederik Burmester The real estate investable universe in 2023
In an uncertain market, it is tempting to prioritize cyclical questions such as the risk of recession and the path of interest rates over structural topics with longer-run implications. But challenging periods in real estate markets can also be attractive times to build exposure to the asset class.1 Questions about how to build portfolios do not diminish in importance just because bond market volatility makes front-page news. In our view, one of the most useful starting points for approaching portfolio construction is having a sense of the size of the real estate investable universe and its subcomponents. This is why we regularly update our estimates of the real estate investable universe and have done so consistently since 2005.We first shared our latest estimates for the size of the global real estate universe in the 2023 edition of ISA Portfolio View. As described there, the vast scale of real estate as an asset class is among the key pillars supporting the case for including property in multi-asset portfolio. But putting a thoughtful number on the size of the asset class is easier said than done. We believe it is worth the effort because quantifying the size and distribution of the market — rather than just a subset covered by a particular index or data source — helps investors sharpen their thinking on target allocations by asset class, geography and investment structure. A full description of our methodology, data sources and summary table by country is available here, and we are glad to provide additional detail upon request.
We estimate market size, defined as aggregate gross asset value, for three nested segments, shown below. The largest and most comprehensive estimate is for all property held for the income it provides, inclusive of all types of owners (except owner-occupiers) and all quality levels. Using a separate methodology, we also estimate real estate owned by institutional investors, and by one particular type of institutional investor — those whose equity is publicly traded.
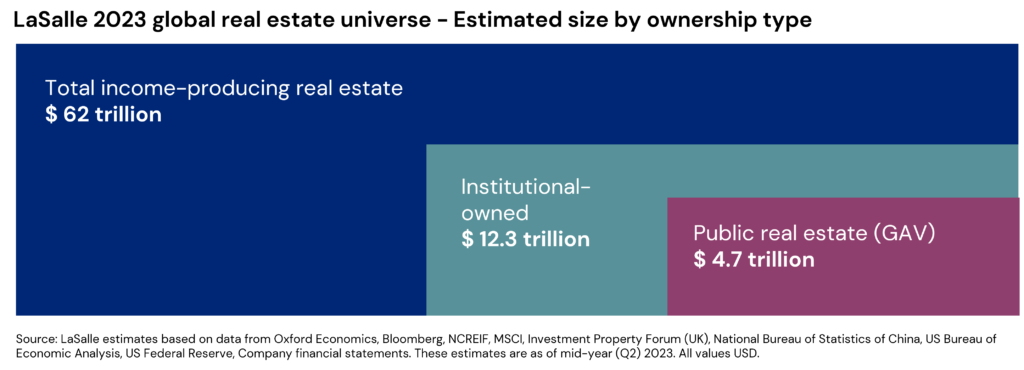
Our analysis shows that one fifth of global real estate is owned by institutional investors, and 40% of that institutional ownership is by listed companies. The estimates also break down market size by country, property type and city, using a methodology combining several bottom-up and top-down sources.
We take a closer look in this ISA Briefing at three key findings from the real estate universe analysis: (1) global income-producing real estate has recently ebbed to a below-average size relative to GDP, (2) real estate value has a fairly even distribution across the three major global regions and (3) those regions differ significantly in how real estate is distributed across metros, implying different optimal diversification strategies.
1: Real estate is large, but at a cyclical ebb
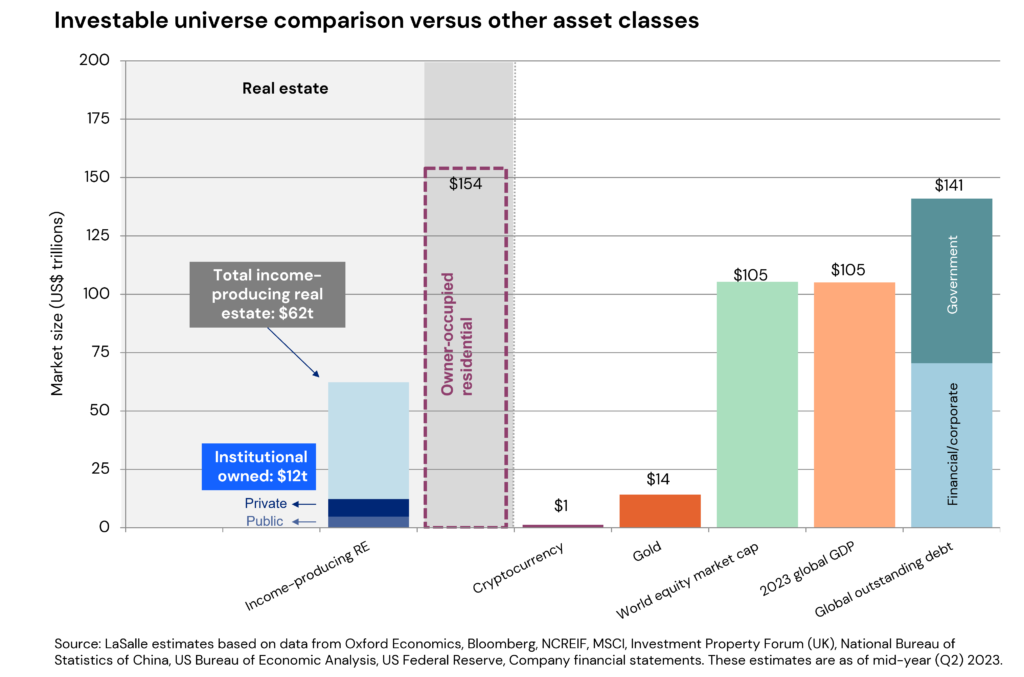
Figures in trillions can be so enormous that they lose some meaning — so it is helpful to put those numbers in context. An illuminating comparison is to put income producing real estate alongside other asset classes like stocks and bonds, as shown in the graph below.
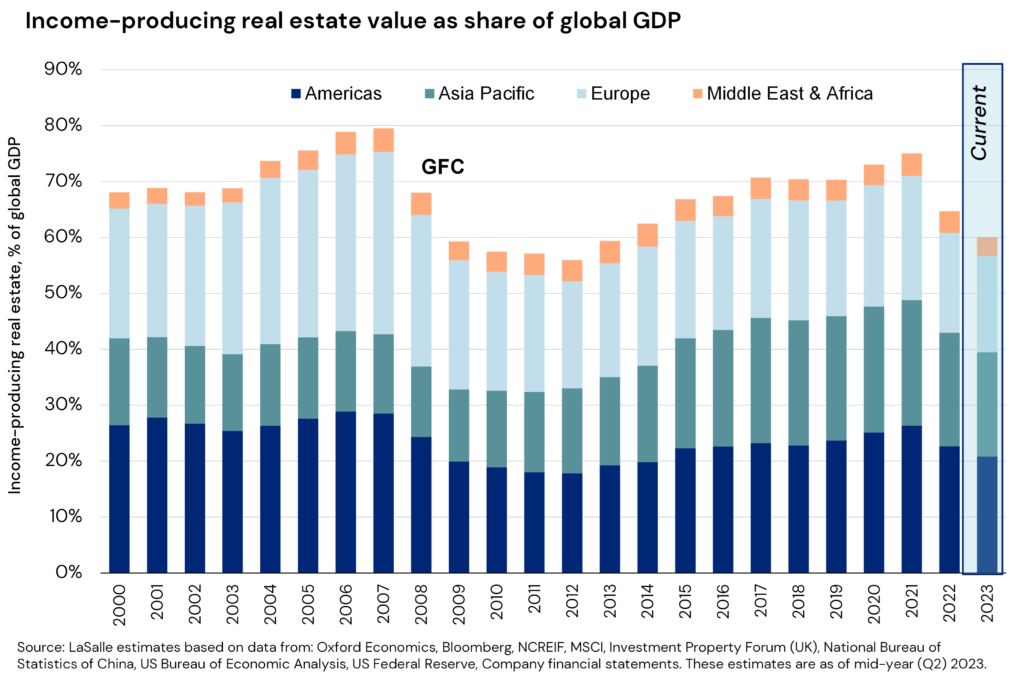
These estimates show global real estate is a smaller sibling to stocks and bonds but very much in the same family of major asset classes. Notably, owner-occupied residential real estate, which is not included in LaSalle’s real estate estimates, is significantly larger in size than all income-producing property, and even larger than the global fixed-income market.Another useful comparator, shown below, is against global GDP. We estimate that real estate is equal to 60% of global GDP in 2023. This puts it at a low ebb relative to recent history. This is consistent with the historic pattern of real estate comprising a higher share of GDP late in expansions and then a lower share of GDP in repricing episodes. Currently our real estate market size estimate is near previous cyclical lows as a share of GDP seen in 2009-2012. Since 2000, our real estate market size estimates have averaged 68% of global GDP.
2: Still a global asset class
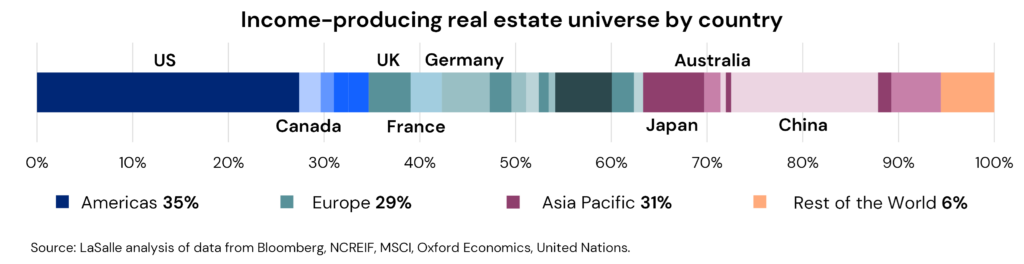
A second key finding from LaSalle’s universe estimates is the relatively even split in value observed between the three major regions of the Americas, Asia Pacific, and Europe. We estimate that 35% of income producing property is in the Americas, 31% in Asia Pacific, and 29% is in Europe. We believe these estimates from LaSalle’s real estate universe analysis better reflect the true opportunity set than other splits based on simple GDP or real estate indices, which can sometimes be lopsided based on where coverage is greatest or which types of investment fund products predominate. For example, 67% of the MSCI Global Property Fund Annual Index AUM is in North America.2The split above suggests an even distribution of opportunities by region. At the same time, our national estimates also show global diversification can be achieved with a small number of countries. The eight countries with the most institutional-invested real estate together account for 70% of the invested universe. A focus on these larger countries — as well as multi-country funds — can enable investors to efficiently achieve diverse exposures, while also managing the challenges that come with differences in market practices, currency, regulation and building market knowledge.
3: Big regional differences in universe at city level
Our third notable finding emerges when zooming in one level further from the national level to individual cities. Cities and their surrounding metropolitan areas form the underlying building blocks of the real estate universe; they are often the basic level of analysis investors have in mind when comparing market allocations.LaSalle estimates institutional real estate market size are for the entire metropolitan (metro) market — including the principal city and its suburbs that are economically connected to it, adopting official metropolitan area definitions from national statistical agencies where available.
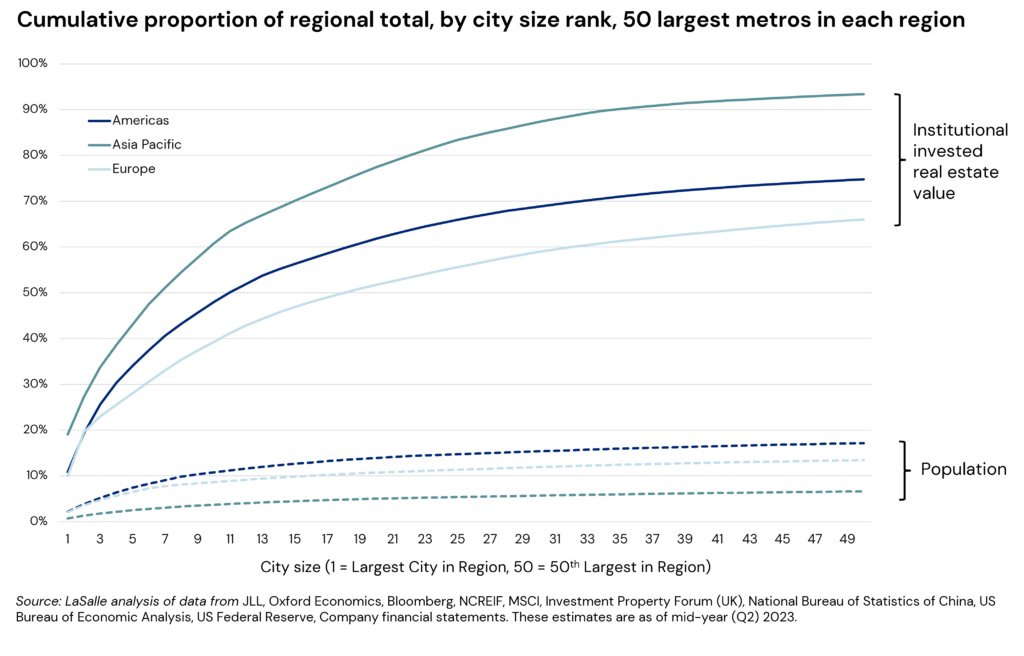
Real estate held in institutional investor portfolios is highly concentrated in the largest metros, and these local market size estimates highlight the degree of that concentration. The 40 largest metropolitan real estate markets account for 58% of all institutional property. Some of the world’s largest metro areas dwarf many individual countries when it comes to institutional real estate ownership. Our latest estimates show that there is likely more institutional-owned real estate in Greater Tokyo than in all but three of the 201 countries covered in our estimates.
The metro market size distribution varies considerably across regions, with important implications for portfolio strategy. Institutional real estate ownership in Asia Pacific is more concentrated in its largest metros than in any other region. And its real estate is far more concentrated in a few cities than its population. In Asia Pacific, 18 metros account for 75% of institutional property, whereas the equivalent metro total is 52 in the Americas. In Europe, real estate is the most dispersed across cities, reflecting its more fragmented quilt of different jurisdictions. Over 100 European metros must be amalgamated to account for 75% of the regional total. Such dispersion makes the task of setting target markets even more complex, which is where tools like the recently released LaSalle European Cities Growth Index (ECGI) can help.
These differences impact investment strategy and approaches to diversification. Asia Pacific’s concentration of large institutional markets implies that investors may be able to achieve diversification by investing in fewer metros, but that it is also a region where each “bet” on geo-market allocation matters more. In Europe and North America, investors are more active across a larger number of medium-sized markets, offering diversification benefits as well as challenges in terms of access and efficiency.
Looking ahead
- The real estate universe is massive — it constitutes a meaningful portion of all global investable assets across asset classes — and therefore is a key piece of diversified mixed asset portfolios. Its ratio to global GDP is now below its long-term average, near past cyclical lows seen on this measure. Over a ten-year horizon, we expect real estate to grow as a share of GDP.
- The real estate universe is evenly dispersed by region (though concentrated by country and city). A globally balanced portfolio would give roughly a one-third weighting each to North America, Asia Pacific and Europe.
- The concentration of institutional real estate in highly transparent countries and in major metro areas implies that investors can achieve a good degree of diversification with a small number of countries and moderate number of metro markets, with differences across region.
- Investable universe estimates can help investors devise ‘neutral weights’ for markets and sectors, which they can then adjust based on structural considerations (e.g. tax status) and their views of relative value. We look forward to sharing our outlook and strategic recommendations for 2024 real estate investment in our upcoming ISA Outlook 2024, the first installment of which will be released on November 14.
Footnotes1 Vintages around the time of market disruption tend to outperform, according to LaSalle analysis of data from the INREV Global IRR Index through Q4 2022. See page 30 of our ISA Portfolio View for a more complete discussion of this analysis.
2 Source: MSCI. Data as of 2022 (most recent available).
Important Notice and DisclaimerThis publication does not constitute an offer to sell, or the solicitation of an offer to buy, any securities or any interests in any investment products advised by, or the advisory services of, LaSalle Investment Management (together with its global investment advisory affiliates, “LaSalle”). This publication has been prepared without regard to the specific investment objectives, financial situation or particular needs of recipients and under no circumstances is this publication on its own intended to be, or serve as, investment advice. The discussions set forth in this publication are intended for informational purposes only, do not constitute investment advice and are subject to correction, completion and amendment without notice. Further, nothing herein constitutes legal or tax advice. Prior to making any investment, an investor should consult with its own investment, accounting, legal and tax advisers to independently evaluate the risks, consequences and suitability of that investment.
LaSalle has taken reasonable care to ensure that the information contained in this publication is accurate and has been obtained from reliable sources. Any opinions, forecasts, projections or other statements that are made in this publication are forward-looking statements. Although LaSalle believes that the expectations reflected in such forward-looking statements are reasonable, they do involve a number of assumptions, risks and uncertainties. Accordingly, LaSalle does not make any express or implied representation or warranty, and no responsibility is accepted with respect to the adequacy, accuracy, completeness or reasonableness of the facts, opinions, estimates, forecasts, or other information set out in this publication or any further information, written or oral notice, or other document at any time supplied in connection with this publication. LaSalle does not undertake and is under no obligation to update or keep current the information or content contained in this publication for future events. LaSalle does not accept any liability in negligence or otherwise for any loss or damage suffered by any party resulting from reliance on this publication and nothing contained herein shall be relied upon as a promise or guarantee regarding any future events or performance.
By accepting receipt of this publication, the recipient agrees not to distribute, offer or sell this publication or copies of it and agrees not to make use of the publication other than for its own general information purposes.
Copyright © LaSalle Investment Management 2023. All rights reserved. No part of this document may be reproduced by any means, whether graphically, electronically, mechanically or otherwise howsoever, including without limitation photocopying and recording on magnetic tape, or included in any information store and/or retrieval system without prior written permission of LaSalle Investment Management.


Jul 01, 2025
PERE: Q&A with Global CEO Mark Gabbay
LaSalle’s Global CEO sat down with PERE to discuss the world’s simplest, most complicated asset class.