

-
LaSalle’s Brian Klinksiek and Tobias Lindqvist (L-R) discuss how changing climate risk should be viewed by investors. Recognition has grown substantially in recent years that climate risk can shape real estate investment outcomes. This owes to an increasing frequency and severity of loss events,1 surging insurance premiums,2 improving data availability and a mounting reporting burden driven by regulations.3 Investors have had to move quickly from acquiring basic climate risk literacy, to sourcing good quality climate risk data, to most recently, leveraging that data into improved investment decisions. There is a clear and rising likelihood that investors on the lagging edge of this process may underperform.
At LaSalle, we have sought to share insights from our own climate risk journey, combining that with broader analysis of our industry’s climate risk challenges and opportunities. In 2022, we partnered with the Urban Land Institute (ULI) on a report, How to choose, use, and better understand climate-risk analytics, which addressed the difficulties in selecting and evaluating climate data from an ever-changing and increasingly crowded—and sometimes contradictory—data provider landscape. In April, we released a new report with ULI, Physical Climate Risks and Underwriting Practices in Assets in Portfolios, which looks at how investors are taking these data and seeking to make better-informed buying, selling and portfolio construction decisions based on them.
While the joint ULI report takes an industry-wide view, this ISA Briefing looks at the topic through the lens of LaSalle’s own investment process. We present three case studies of our evaluation of climate risk on a regional, market and asset-level scale. These examples – one each from each of our global investment regions – illuminate how we are taking account of climate risk and lay out our views on issues investors should be thinking about.
A broader regional view: wide-scale impacts
In 2023, the US recorded 28 weather/climate disaster events for which losses exceeded $1 billion, the highest recorded number of distinct events exceeding that threshold.4 But of course, these events were not uniformly distributed across the country. To better understand the geographic predisposition of parts of the country to these hazards, LaSalle’s US Research and Strategy team developed two separate climate risk indexes, evaluating current and future climate risk. The indexes encompass a range of climate hazards, such as heatwaves, floods and wildfires, with earthquakes added as a non-climate threat. The current climate risk index harnesses machine learning to scrutinize hyper-local data from the Federal Emergency Management Agency (FEMA). Meanwhile, the future climate risk projections rely on data from the Rhodium Group data set, as analyzed by ProPublica and assuming an RCP 8.5 scenario.5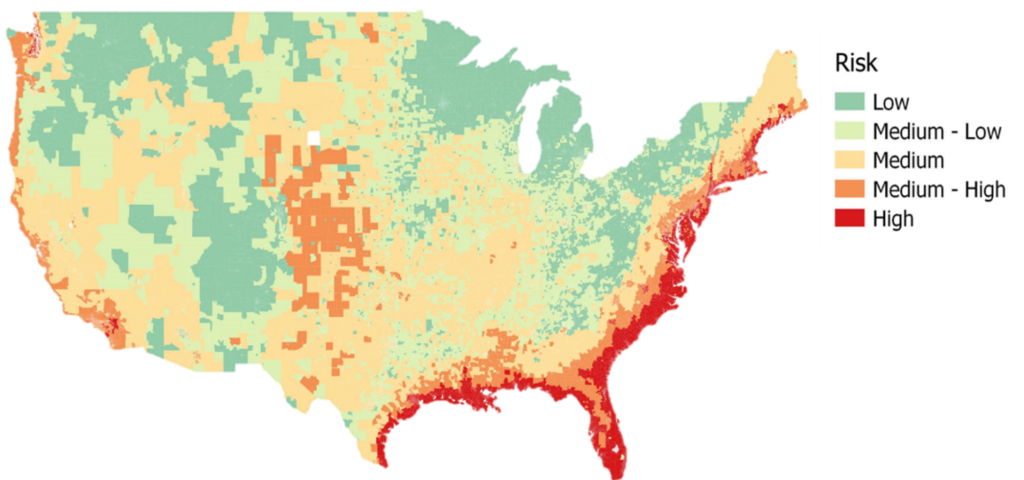
LaSalle US Current Climate Risk Index – Source: FEMA, LaSalle analysis
Looking at climate risk at a regional scale has been useful in several ways. First, it can accelerate analysis of new opportunities by acting as a “yellow flag,” directing resources early in the underwriting process toward deeper analysis into asset-specific climate risk issues that may turn out to be red flags. Second, regional climate risk can be integrated into market-targeting tools, weighing it alongside other factors that influence real estate performance (for example, demographic variables such as population growth and real estate variables like the prospects for rental growth). To this end, LaSalle has embedded these climate risks scores into our proprietary Target Market Analyses (TMAs). Thirdly, it can help frame inquiry into how metro-level performance factors, such as migration patterns, can interact with climate risk over time.On that last point, the map appears to beg a question about recent migration trends that have favored the Sunbelt.6 Are people disproportionally moving to at-risk places, and if so, why? An important follow-on question that is germane for investment strategy is whether climate change may eventually cause a reversal of recently observed migration patterns. Indeed, we do observe a discernible, moderately positive correlation7 (+29%) between climate risk exposure and increased migration over the past five years. This pattern holds, and even intensifies, when considering population growth projections for the next five years (+47% correlation).8
The implication is that regions facing severe climate challenges continue to draw new residents. This suggests that environmental risks may not yet be so widely recognized as to shape behavior. That said, a mere 8% of market value within the NCREIF Property Index’s (NPI) apartment asset base is situated in markets we classify as high-risk.9 This suggests the impact in the near-term on institutional real estate investors will be limited, at least until climate change is severe enough to routinely impact markets in the next less risky band, which encompasses 16% of total NPI apartment value.10 Either way, investors looking to the long-term would be wise to consider how people will respond to growing climate hazards in high-risk markets. If a major reaction is that Sunbelt denizens relocate back to the Rustbelt, that could have significant implications for regional economic growth and real estate market prospects.
A market-level view: Evaluating mitigating infrastructure
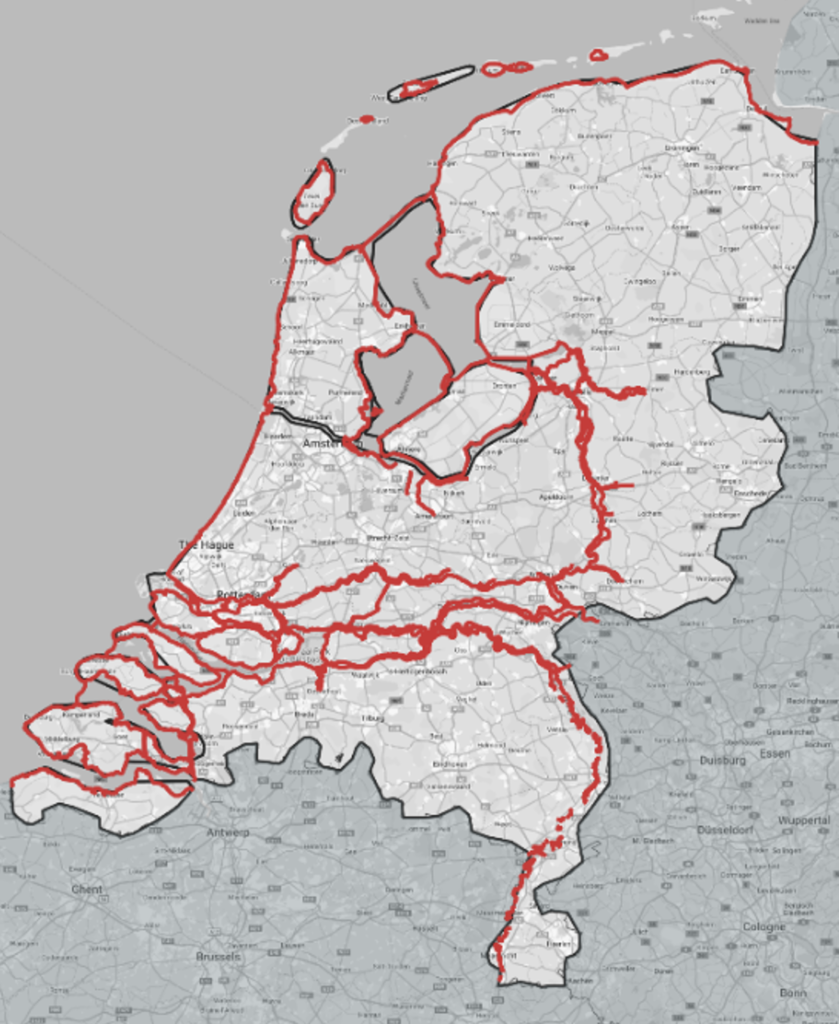
Below the regional level, it is at the scale of an individual metro area where different degrees of exposure to climate risk can be evaluated with more granularity. It is often at this level where both in-place and planned efforts to mitigate the potential impacts of climate hazards can be identified. As we discussed in our 2022 ULI report, such measures can confound traditional climate risk data if they ignore its impact.For example, when overlaying LaSalle’s global portfolio with raw data from our climate risk providers, Amsterdam and its broader ‘Randstad’ region stand out as especially exposed to sea-level rise. Not considering any protective infrastructure, we estimate that 52% of Amsterdam and 38% of Rotterdam commercial property would have a significant exposure to severe flood.11

Dutch primary flood defenses
Thankfully, the Dutch have been building dams and levees to protect their low landmass from flooding for centuries.12 Modern infrastructure investment accelerated in the wake of the 1953 North Sea flood – a combination of a severe European windstorm and high spring tide that caused the sea to flood land up to 5.6 meters above mean sea level.13 The ‘Deltawerken’ (Delta Works), now complete, consists of a set of storm surge barriers, locks and dams mainly located in the south of the country. But the Dutch flood defense program extends beyond the Delta Works,14 encompassing almost 1,500 constructed barriers, including more than 20,000 kilometers of dikes, enough to encircle the country over 15 times. In fact, the Delta Works program has evolved into the Delta Programme, a continuous project that take future effects of climate change into account, with a target of 100% of the Dutch population protected by floods not exceeding a 1 in 100,000-year event by 2050.15The presence of these flood defense programs is of imperative importance when considering the Dutch markets for investments. We find that many climate risk data providers do not adjust for the Netherlands’ formidable stock of anti-flood infrastructure investment which mitigates much of the risk. Investors who act as uncritical “takers” of unadjusted climate risk stats may thus excessively underweight the Dutch market.
An asset-level view
Below the regional and market level, the asset level is where the outcomes of climate hazards have the most direct impact on a building’s structural integrity or the ability to access and operate a property. An asset manager’s actions can directly influence a building’s capacity to withstand climate-related hazards. This tends to be the most impactful when such interventions are made during the design phase of the development.For example, take the case of a LaSalle logistics development in Osaka, Japan, a city that has historically been vulnerable to flooding due to its geographical location, with much of the urban area made up of flat lowlands that make natural drainage a challenge in the event of tsunamis and heavy rainfall.16 The local city planning assesses the maximum level water could rise above sea level by submarket in the event of a flood. The flood height varies by location while considering additional factors such as the city’s infrastructure (i.e., floodgates and seawalls) and the overall elevation of the submarket. In the case of one of LaSalle’s Osaka Bay logistics developments, the subject warehouse is at a site where water levels could rise to three meters above sea level in the case of a flood.17
Seawalls, ranging in height from 5.7-7.2 meters protect the asset from extreme floods coming from the sea. To further mitigate the flood risk in the case of extreme rainfall or failure of the sea walls, the warehouse is designed with an elevated floor plate that puts the ground level 1.4 meters above mean sea level, and places key building equipment on the second floor, minimizing potential damage to the asset in the event of flood. This effort resulted in a 4.4 meter clearance above sea level (i.e., sea level + 1.4 meter buffer + 3 meters = 4.4 meters), which is above the required 3.5 meters above sea level (i.e., sea level + 1.4 meter buffer + 2.05 meters = 3.45 meters) for the location. In addition, the property management team has been trained and equipped to minimize flood damage on the first floor by closing the doors and shutters and placing sandbags in any gaps. By incorporating considerations to mitigate flood risk when designing the warehouse, the asset is well positioned to support tenants’ business continuity plans in the event of a flood.
Looking ahead
- The impacts of an evolving climate need to be considered through multiple lenses, from country or continent spanning impacts, down to the level of individual assets. At all levels it is necessary to understand the interplay between the impact of climate on people, how governing bodies are responding to it, and how asset and investment managers have opportunities to better safeguard their portfolios against climate-related risks.
- Investors should use climate risk data, but apply an overlay of judgement, particularly concerning factors that climate risk data providers generally do not incorporate well. A key example of this is the impact of protective infrastructure. Investors should ask: What mitigating infrastructure is currently in place? Over what time horizon is this accounted for in the present time? Are the plans to strength, expand or enhance local infrastructure in the future? Are these initiatives being appropriately funded, to ensure that plans become a reality?
- While our collaboration with ULI on two reports is rooted in a desire to help the industry adopt best practices, standardization need note – and indeed should not – be the central goal. In the future, we expect an increasing share of real estate transactions to be at least partly motivated for buyers’ and sellers’ disagreement on the climate risks faced by a property.18 With increasing severity and intensity of climate-related loss events and surging insurance costs, it is our view that players that get climate risk right are likely to outperform those who do not. Having a differentiated climate risk process could lead to differentiated investment outcomes.
Footnotes1 Source: National Centres for Environmental Information of the National Oceanic and Atmospheric Administration (NOAA). See Billion Dollar Weather and Climate Disasters
2 Source: The Climbing Costs to Insure US Commercial Real Estate, MSCI, November, 29 2023
3 The TCFD framework which has now been absorbed by IFRS’ ISSB, serves as the framework with which other international reporting standards setters seek to align such as the US SEC who voted in favour of The enhancement and standardization of climate-related disclosure, or the UK Government and the Sustainability Standards Board of Japan who will align its disclosure standards with ISSB.
4 According to the National Centers for Environment Information (NCEI). $1 billion threshold adjusted for inflation in historical periods. See https://www.ncei.noaa.gov/access/billions/.
5 RCP refers to Representative Concentration Pathway, a standard for modeling future climate scenarios of greenhouse gas concentration in the atmosphere. RCP 8.5 represents an extreme case scenario. See this Intergovernmental Panel on Climate Change (IPCC) glossary for more detail.
6 For more discussion on this trend, see our recent ISA Briefing, US migration trends and (U)rbanization.
7 Cross-sectional correlation between the LaSalle current climate risk index and the population change in the top 45 US metro areas between December 2018 and December 2023.
8 Cross-sectional correlation between the LaSalle future climate risk index and population change in the top 45 US metro areas between December 2023 and December 2028 based on Moody’s forecast as of February 2024.
9 Source: LaSalle analysis of data from NCREIF, FEMA.
10 Source: LaSalle analysis of data from NCREIF, FEMA.
11 Source: LaSalle analysis of MSCI data.
12 Source: The Dutch experience in flood management: A history of institutional learning
13 Source: The devastating storm of 1953, The History Press
14 Source: Dutch primary flood defenses, Nationaal Georegister
15 See Delta Programme 2024
16 See Osaka city – Flood disaster prevention map outline from the Osaka City Office of Emergency Management.
17 Estimates of maximum flood depth are based on historical records of natural disasters such as earthquakes, river floods and tsunamis that have occurred as reported by Japan’s Ministry of Land, Infrastructure and Tourism.
18 A superficial view of markets is that transactions are based on agreement on value. More accurately, buyers and sellers agree on a price, but their willingness to transact is based on disagreement on value. A seller, for example, may have a less bullish view on NOI growth prospects than a buyer. We expect the same disagreement on climate-related risk/reward trade-offs to be increasingly important.
This publication does not constitute an offer to sell, or the solicitation of an offer to buy, any securities or any interests in any investment products advised by, or the advisory services of, LaSalle Investment Management (together with its global investment advisory affiliates, “LaSalle”). This publication has been prepared without regard to the specific investment objectives, financial situation or particular needs of recipients and under no circumstances is this publication on its own intended to be, or serve as, investment advice. The discussions set forth in this publication are intended for informational purposes only, do not constitute investment advice and are subject to correction, completion and amendment without notice. Further, nothing herein constitutes legal or tax advice. Prior to making any investment, an investor should consult with its own investment, accounting, legal and tax advisers to independently evaluate the risks, consequences and suitability of that investment.
LaSalle has taken reasonable care to ensure that the information contained in this publication is accurate and has been obtained from reliable sources. Any opinions, forecasts, projections or other statements that are made in this publication are forward-looking statements. Although LaSalle believes that the expectations reflected in such forward-looking statements are reasonable, they do involve a number of assumptions, risks and uncertainties. Accordingly, LaSalle does not make any express or implied representation or warranty, and no responsibility is accepted with respect to the adequacy, accuracy, completeness or reasonableness of the facts, opinions, estimates, forecasts, or other information set out in this publication or any further information, written or oral notice, or other document at any time supplied in connection with this publication. LaSalle does not undertake and is under no obligation to update or keep current the information or content contained in this publication for future events. LaSalle does not accept any liability in negligence or otherwise for any loss or damage suffered by any party resulting from reliance on this publication and nothing contained herein shall be relied upon as a promise or guarantee regarding any future events or performance.
By accepting receipt of this publication, the recipient agrees not to distribute, offer or sell this publication or copies of it and agrees not to make use of the publication other than for its own general information purposes.
Copyright © LaSalle Investment Management 2024. All rights reserved. No part of this document may be reproduced by any means, whether graphically, electronically, mechanically or otherwise howsoever, including without limitation photocopying and recording on magnetic tape, or included in any information store and/or retrieval system without prior written permission of LaSalle Investment Management.

Jul 01, 2025
PERE: Q&A with Global CEO Mark Gabbay
LaSalle’s Global CEO sat down with PERE to discuss the world’s simplest, most complicated asset class.